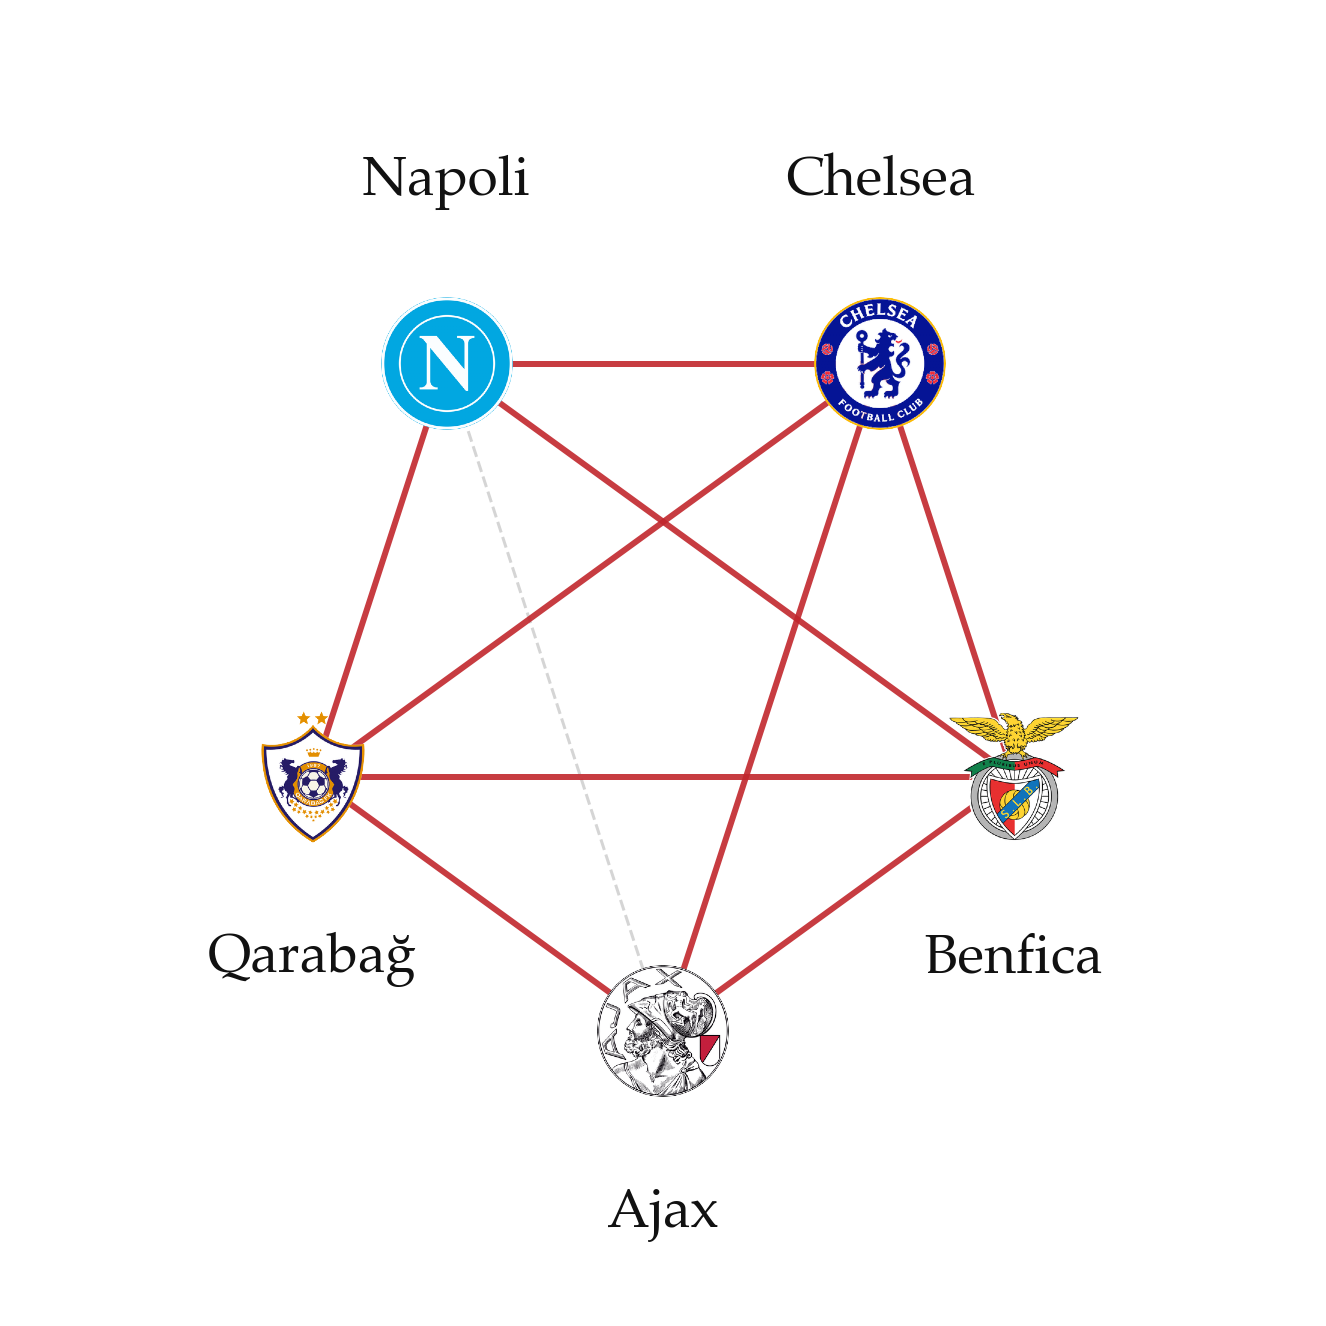
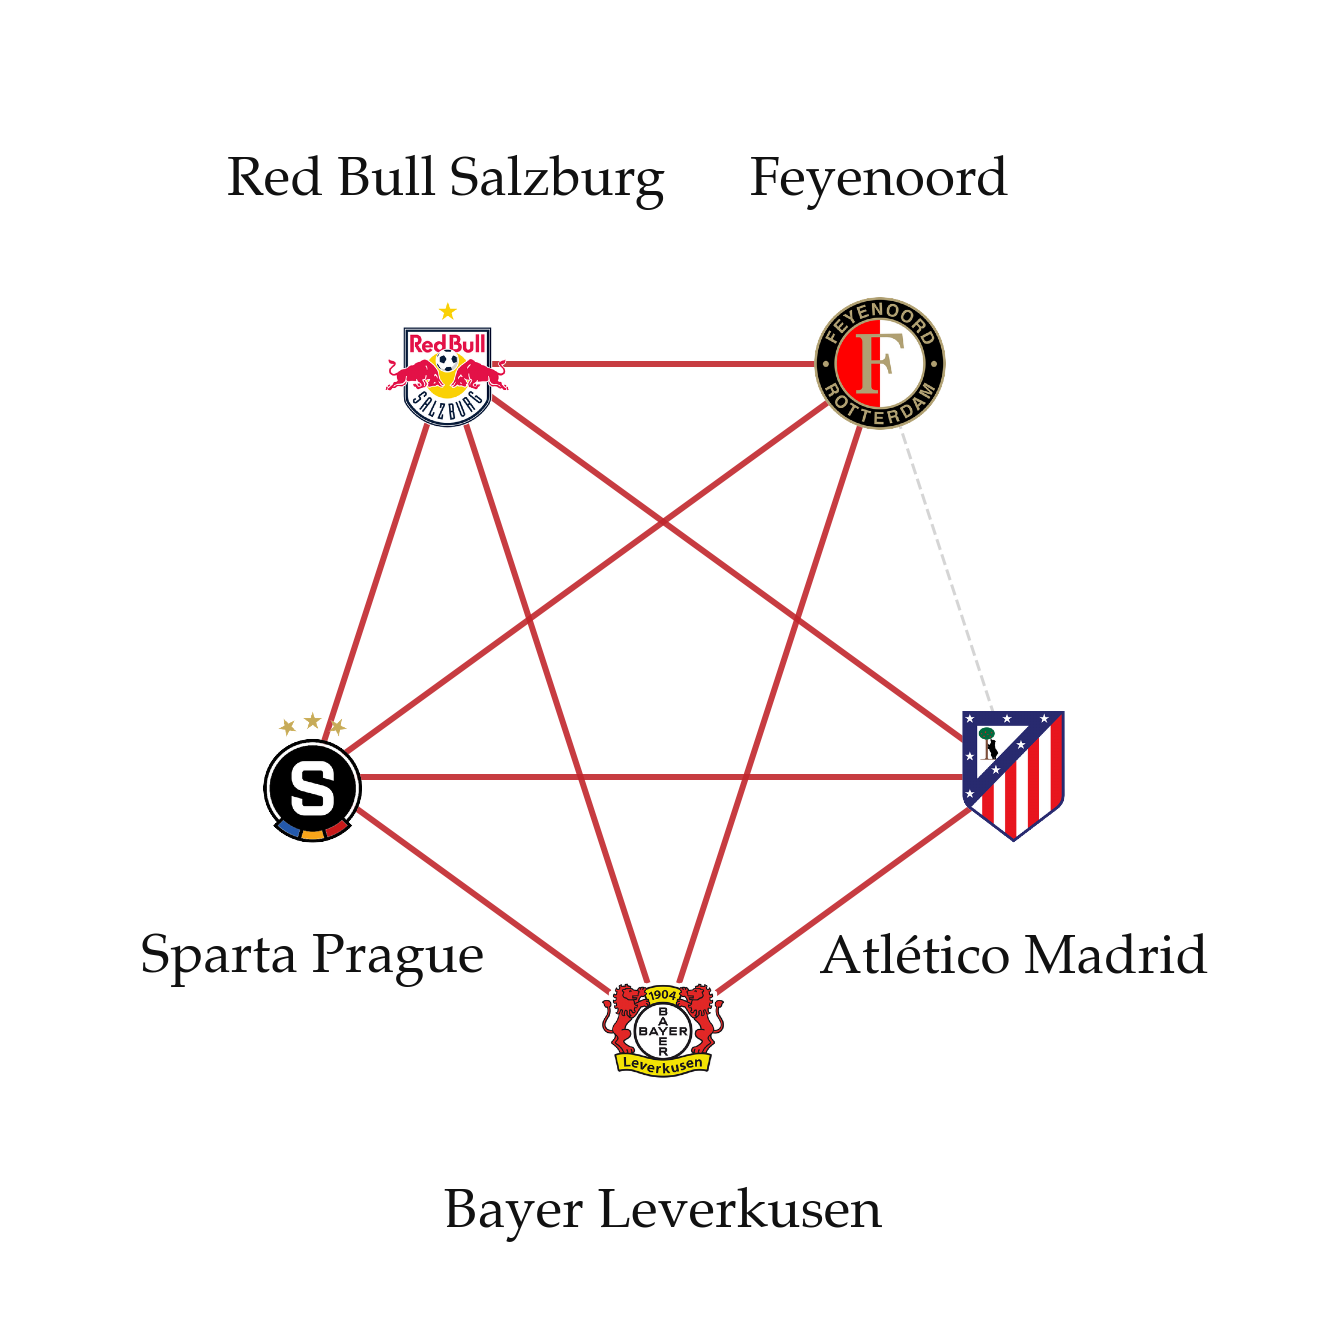
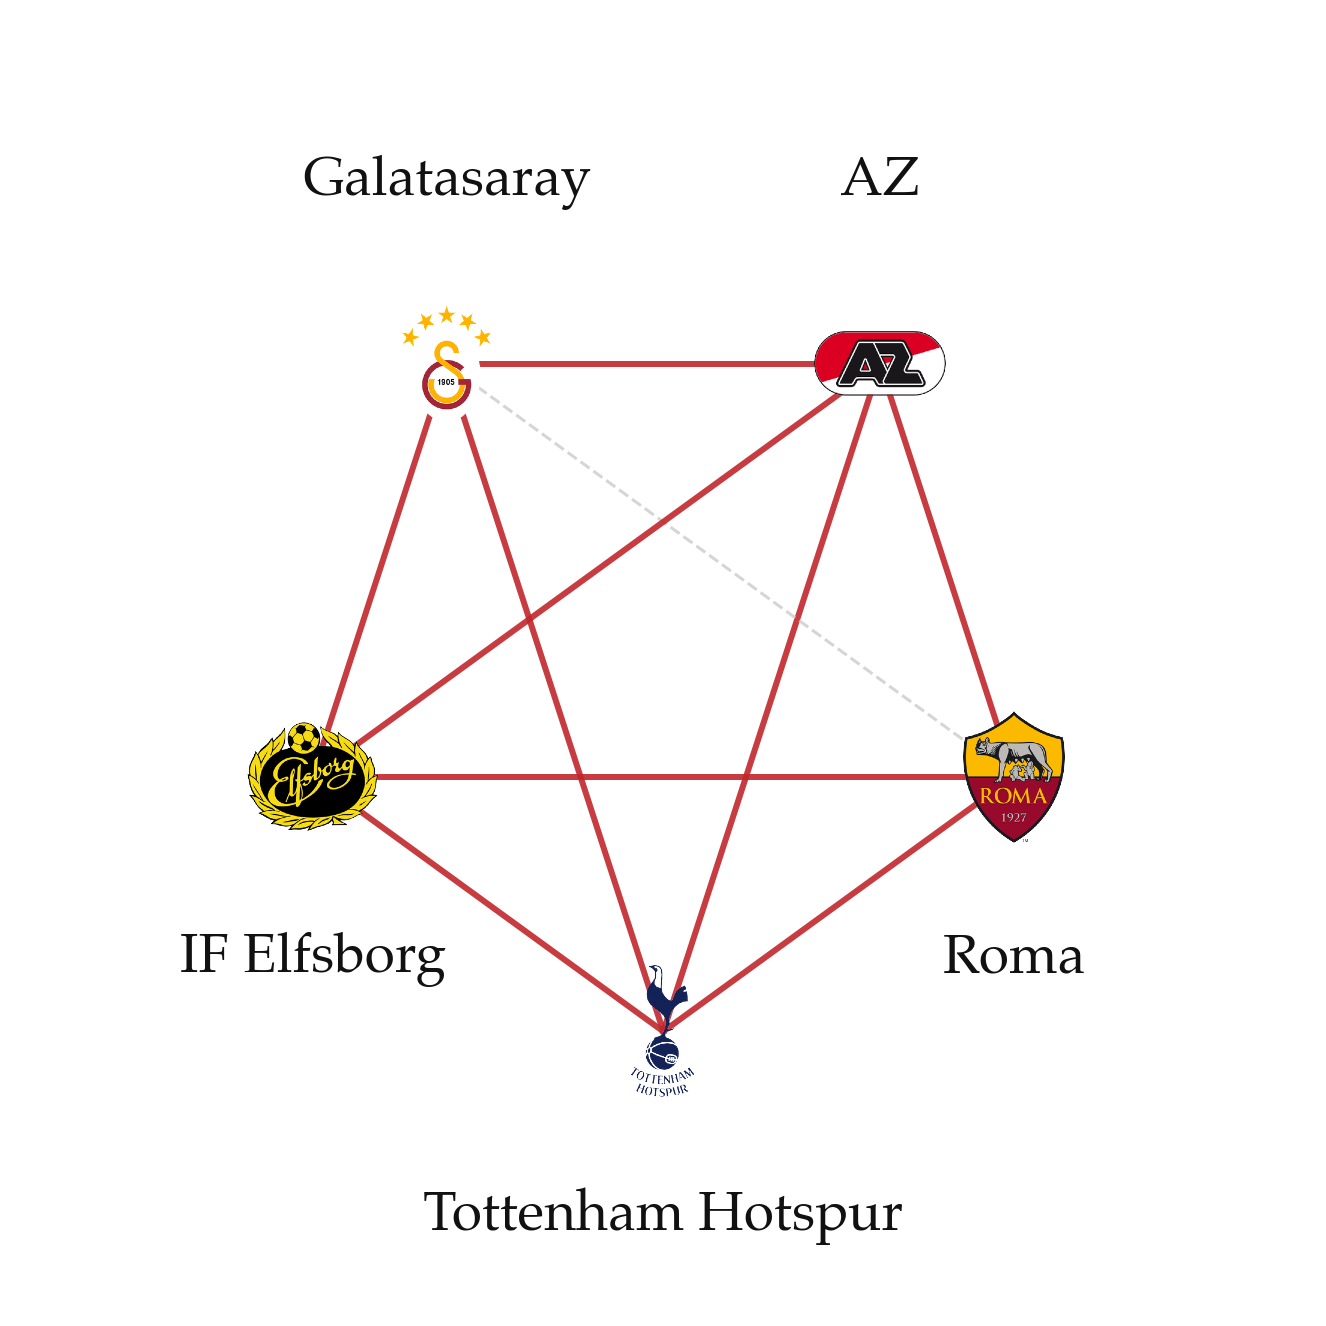
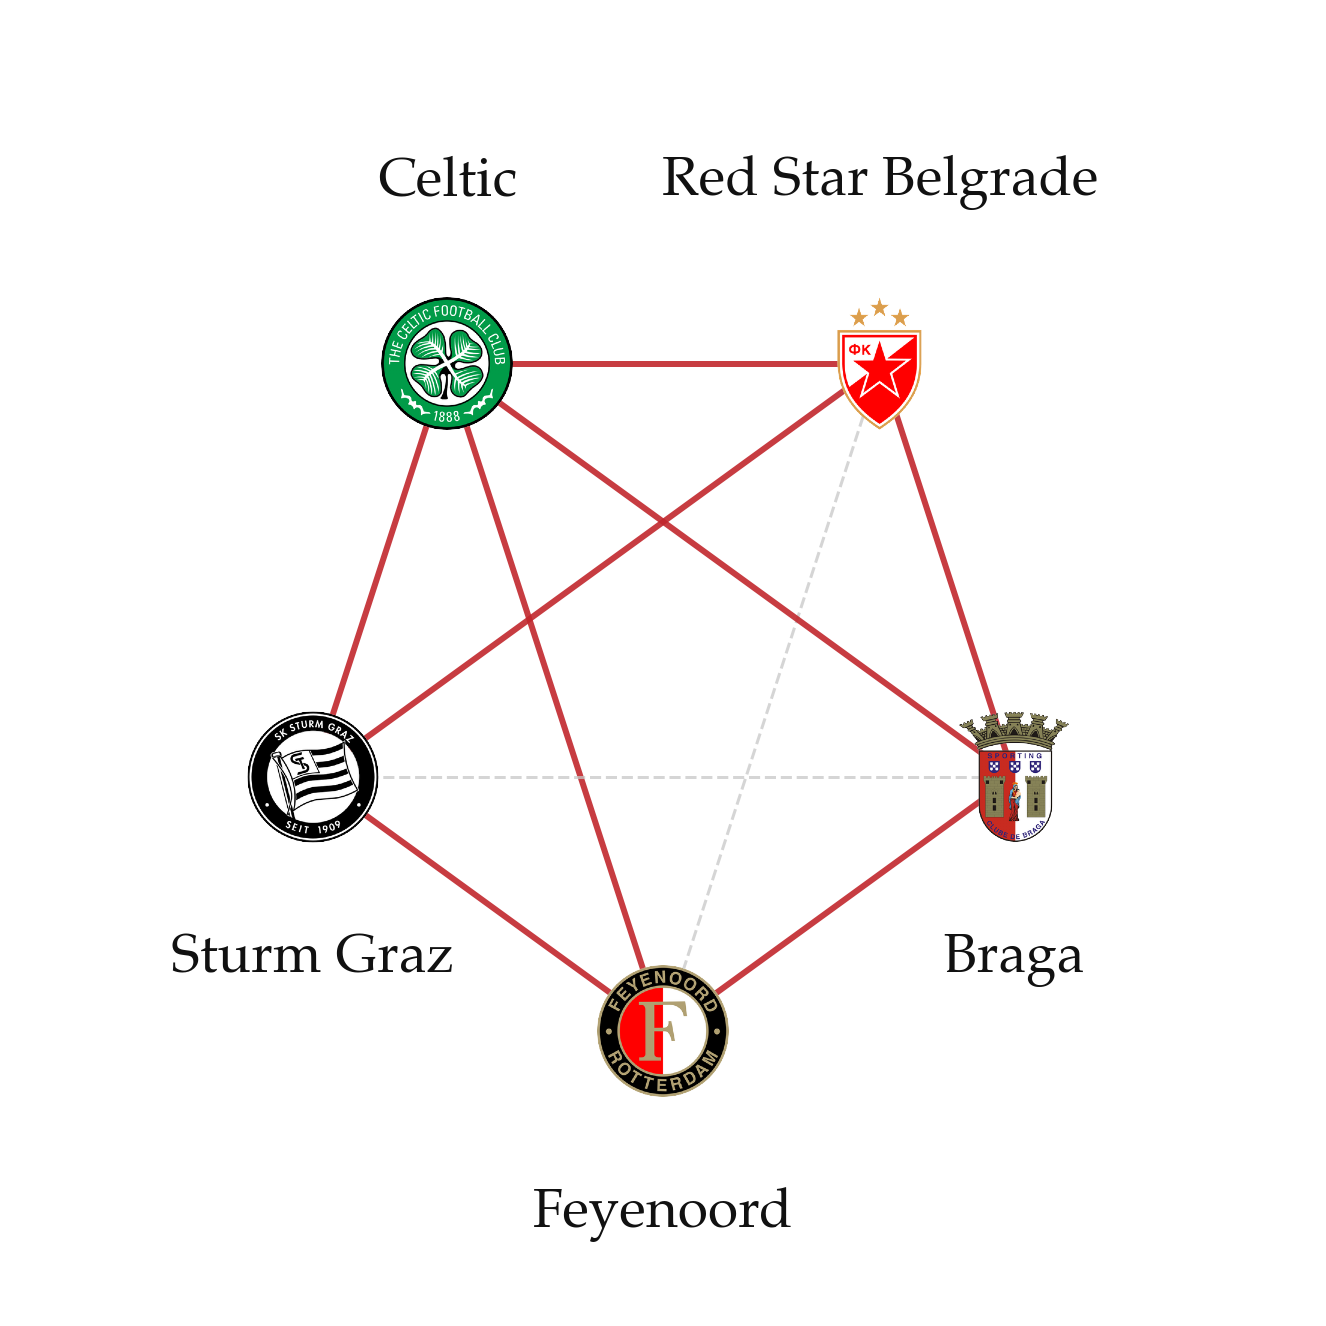
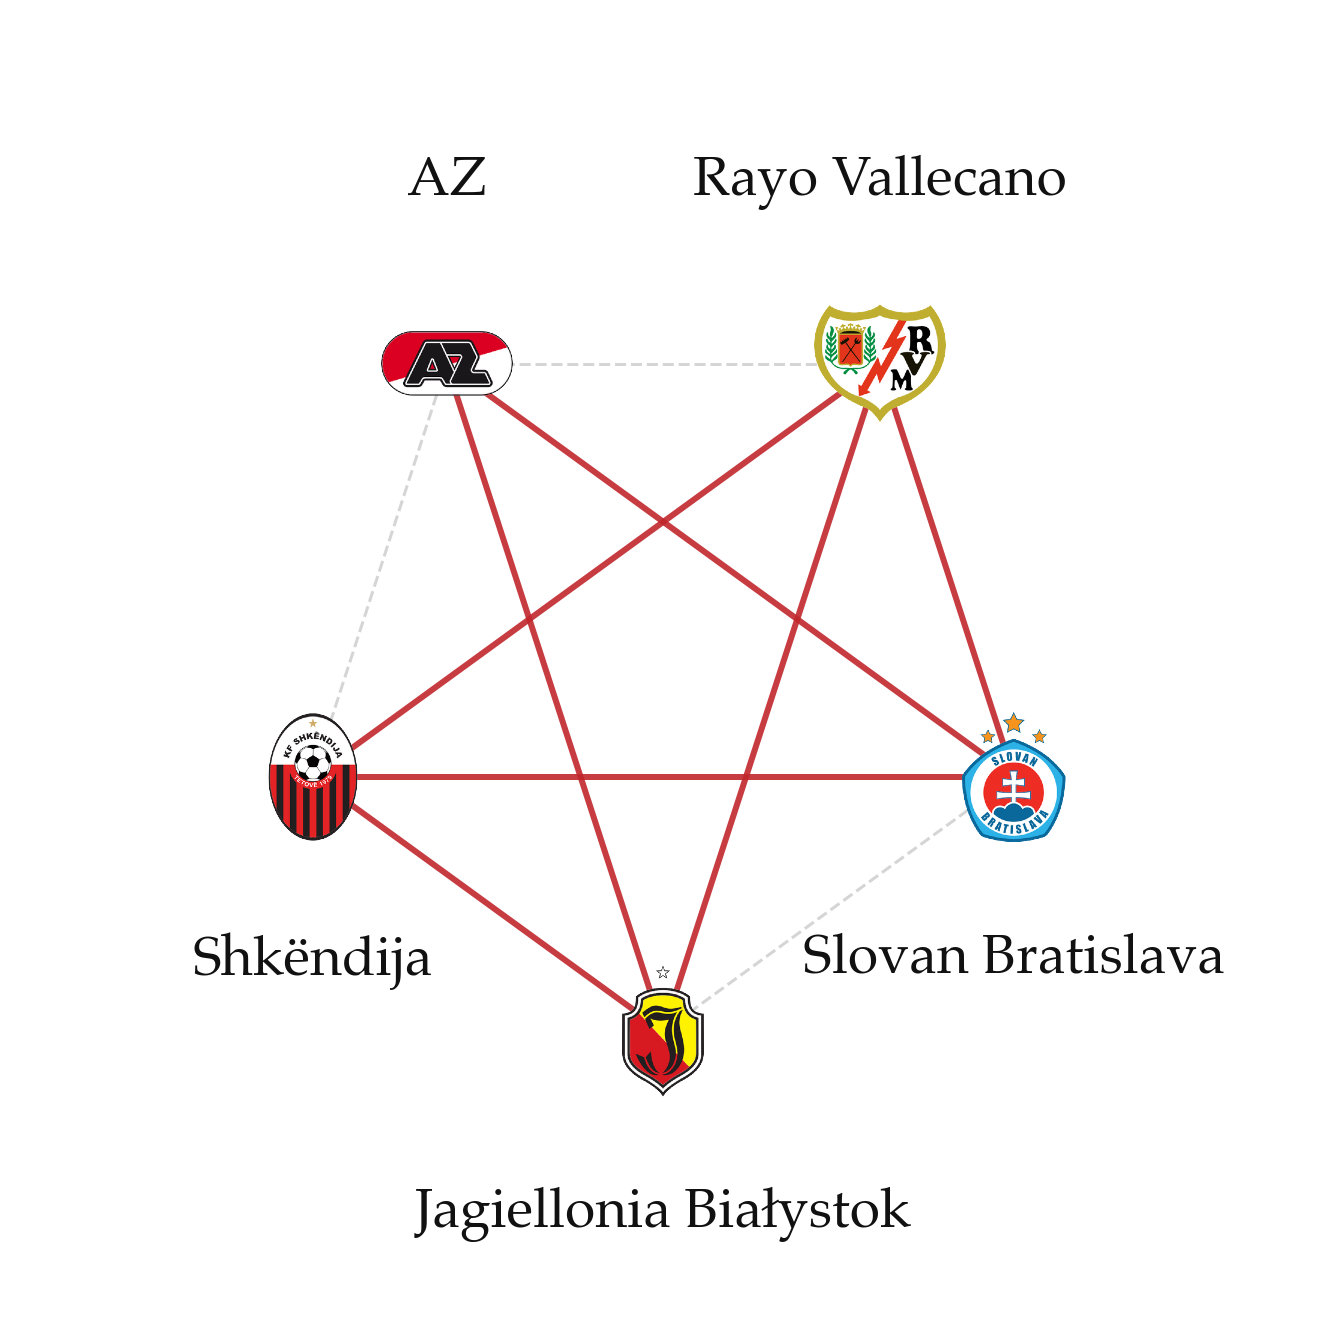
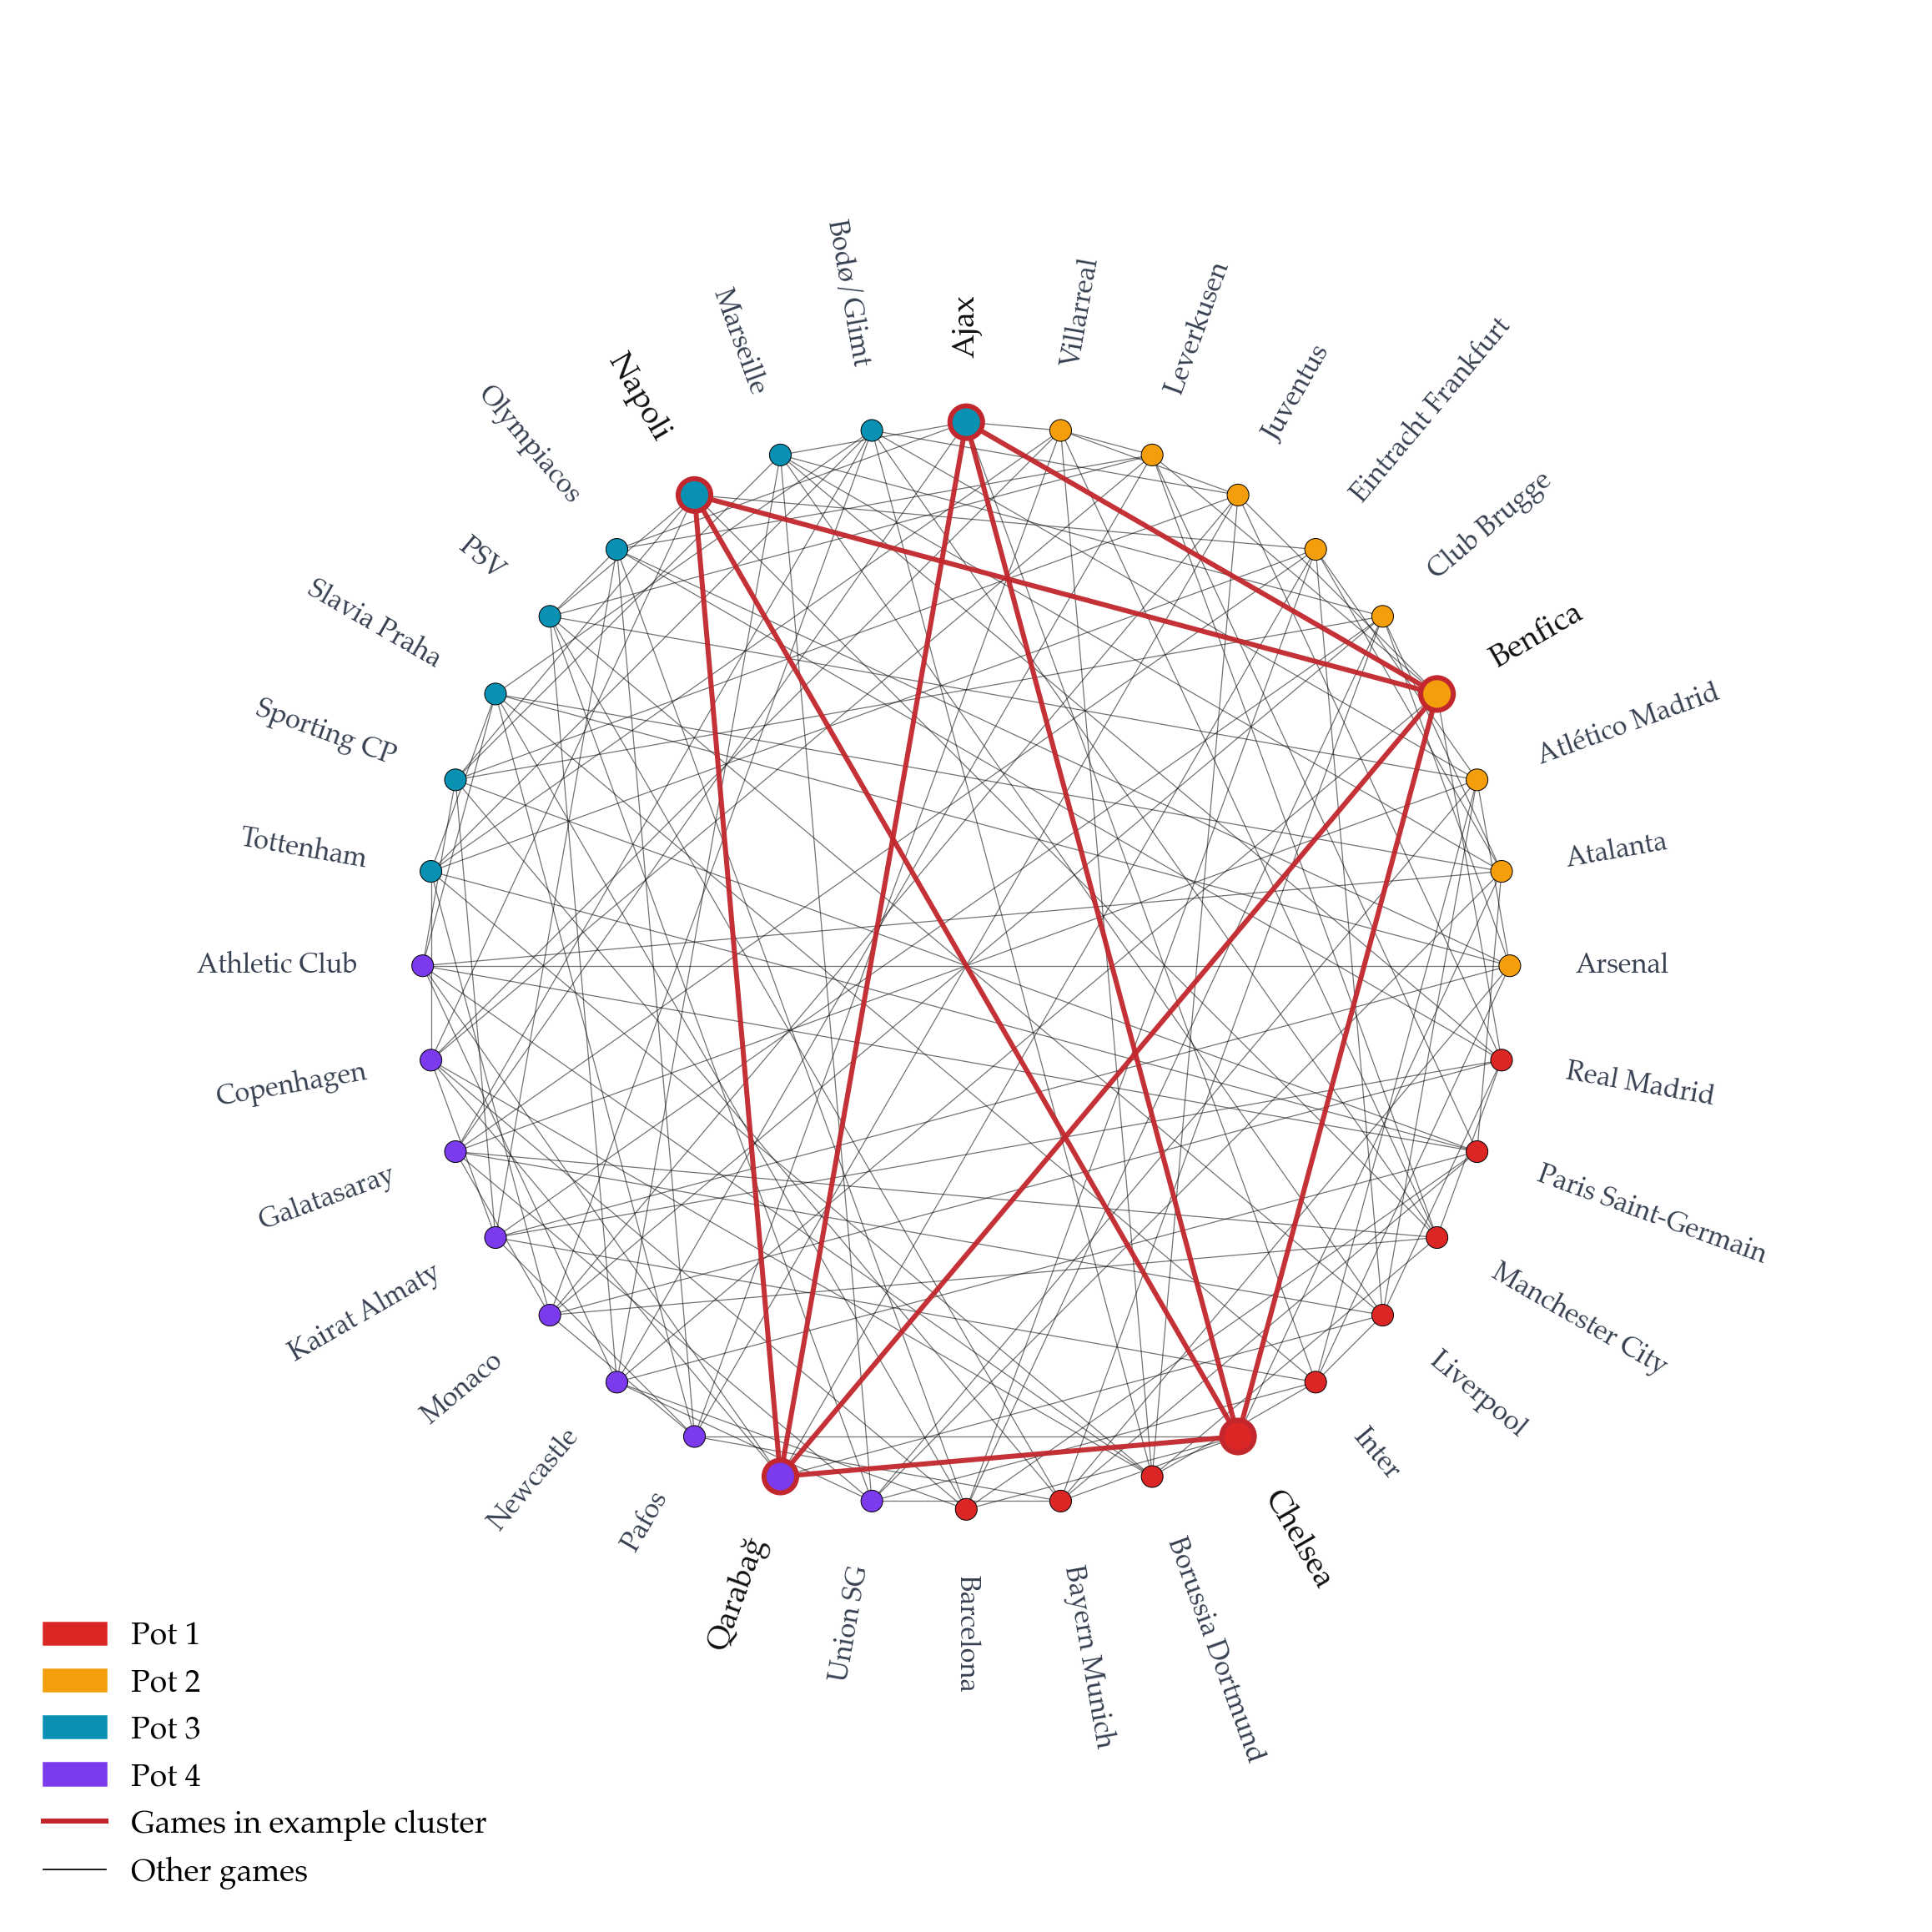
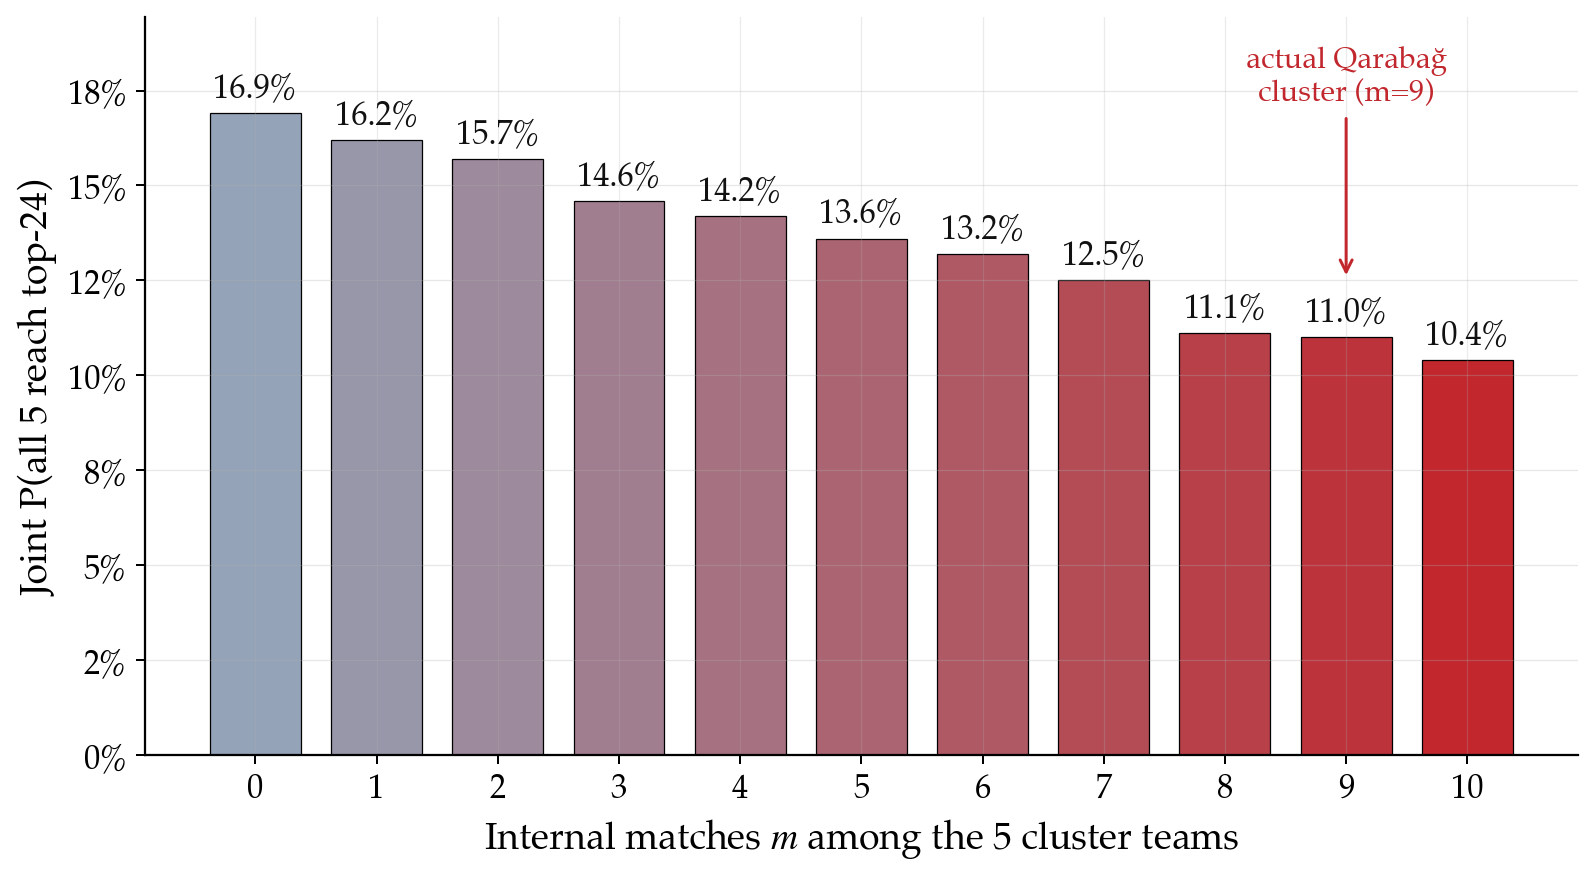
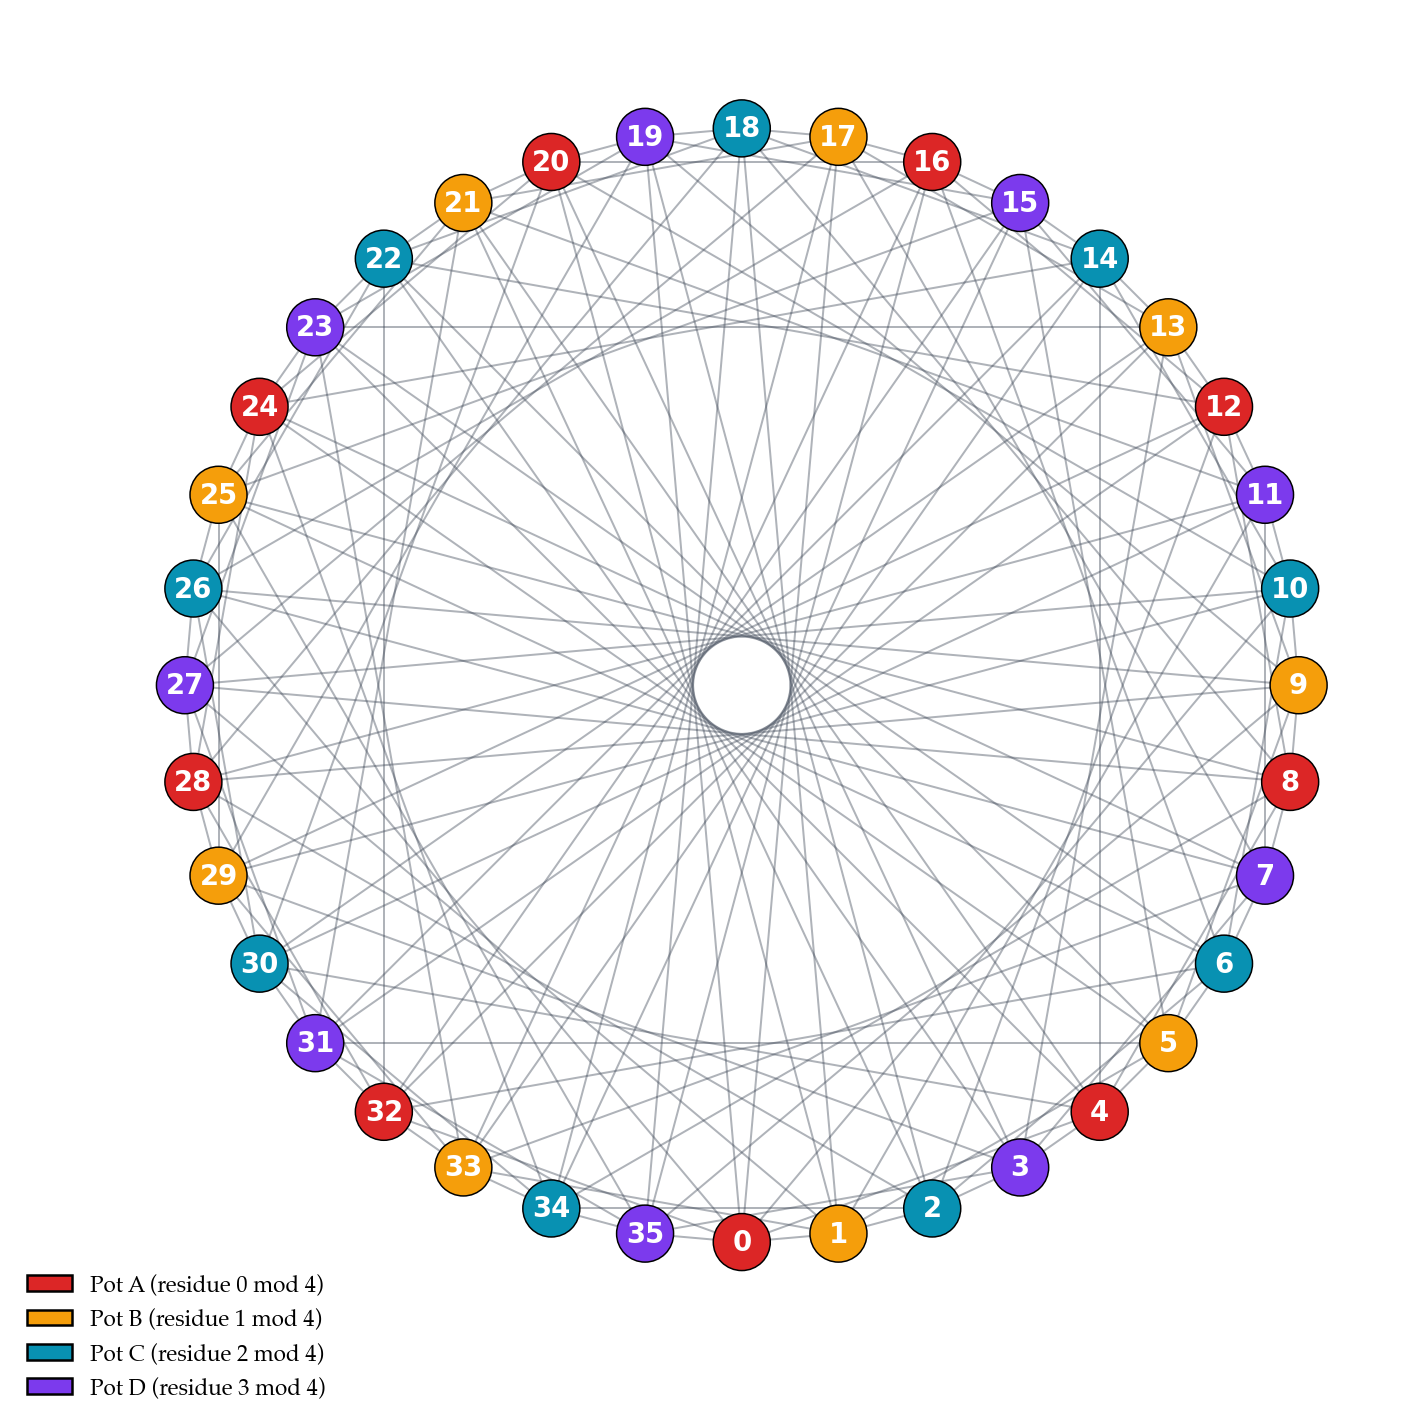
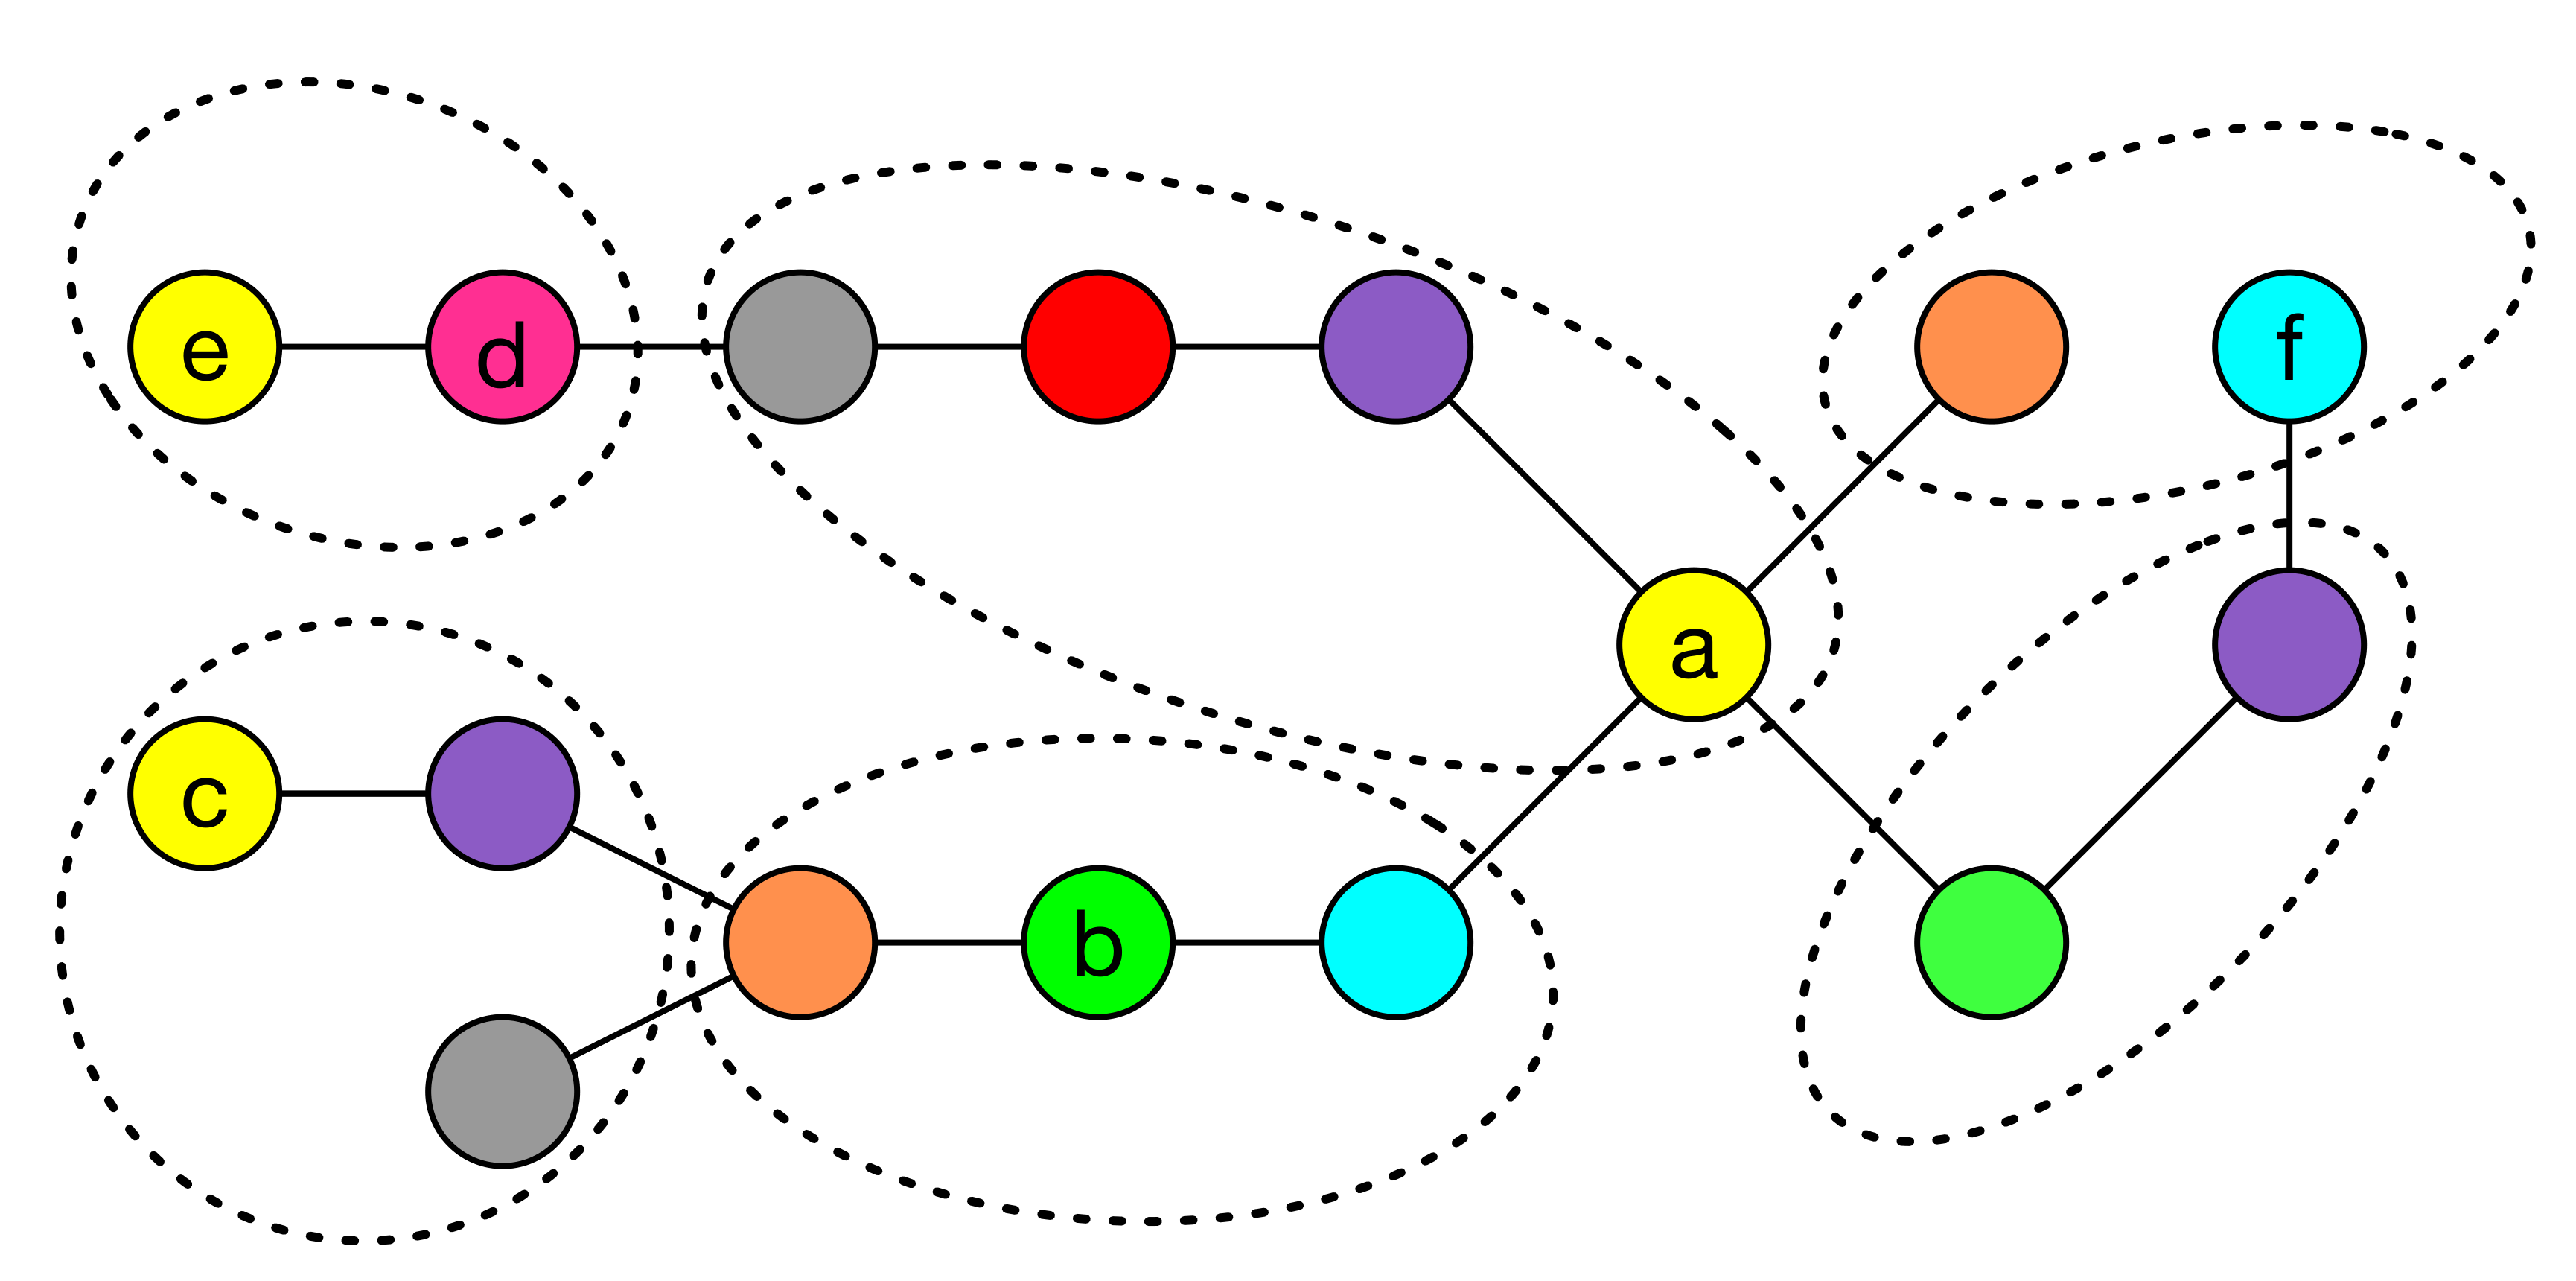
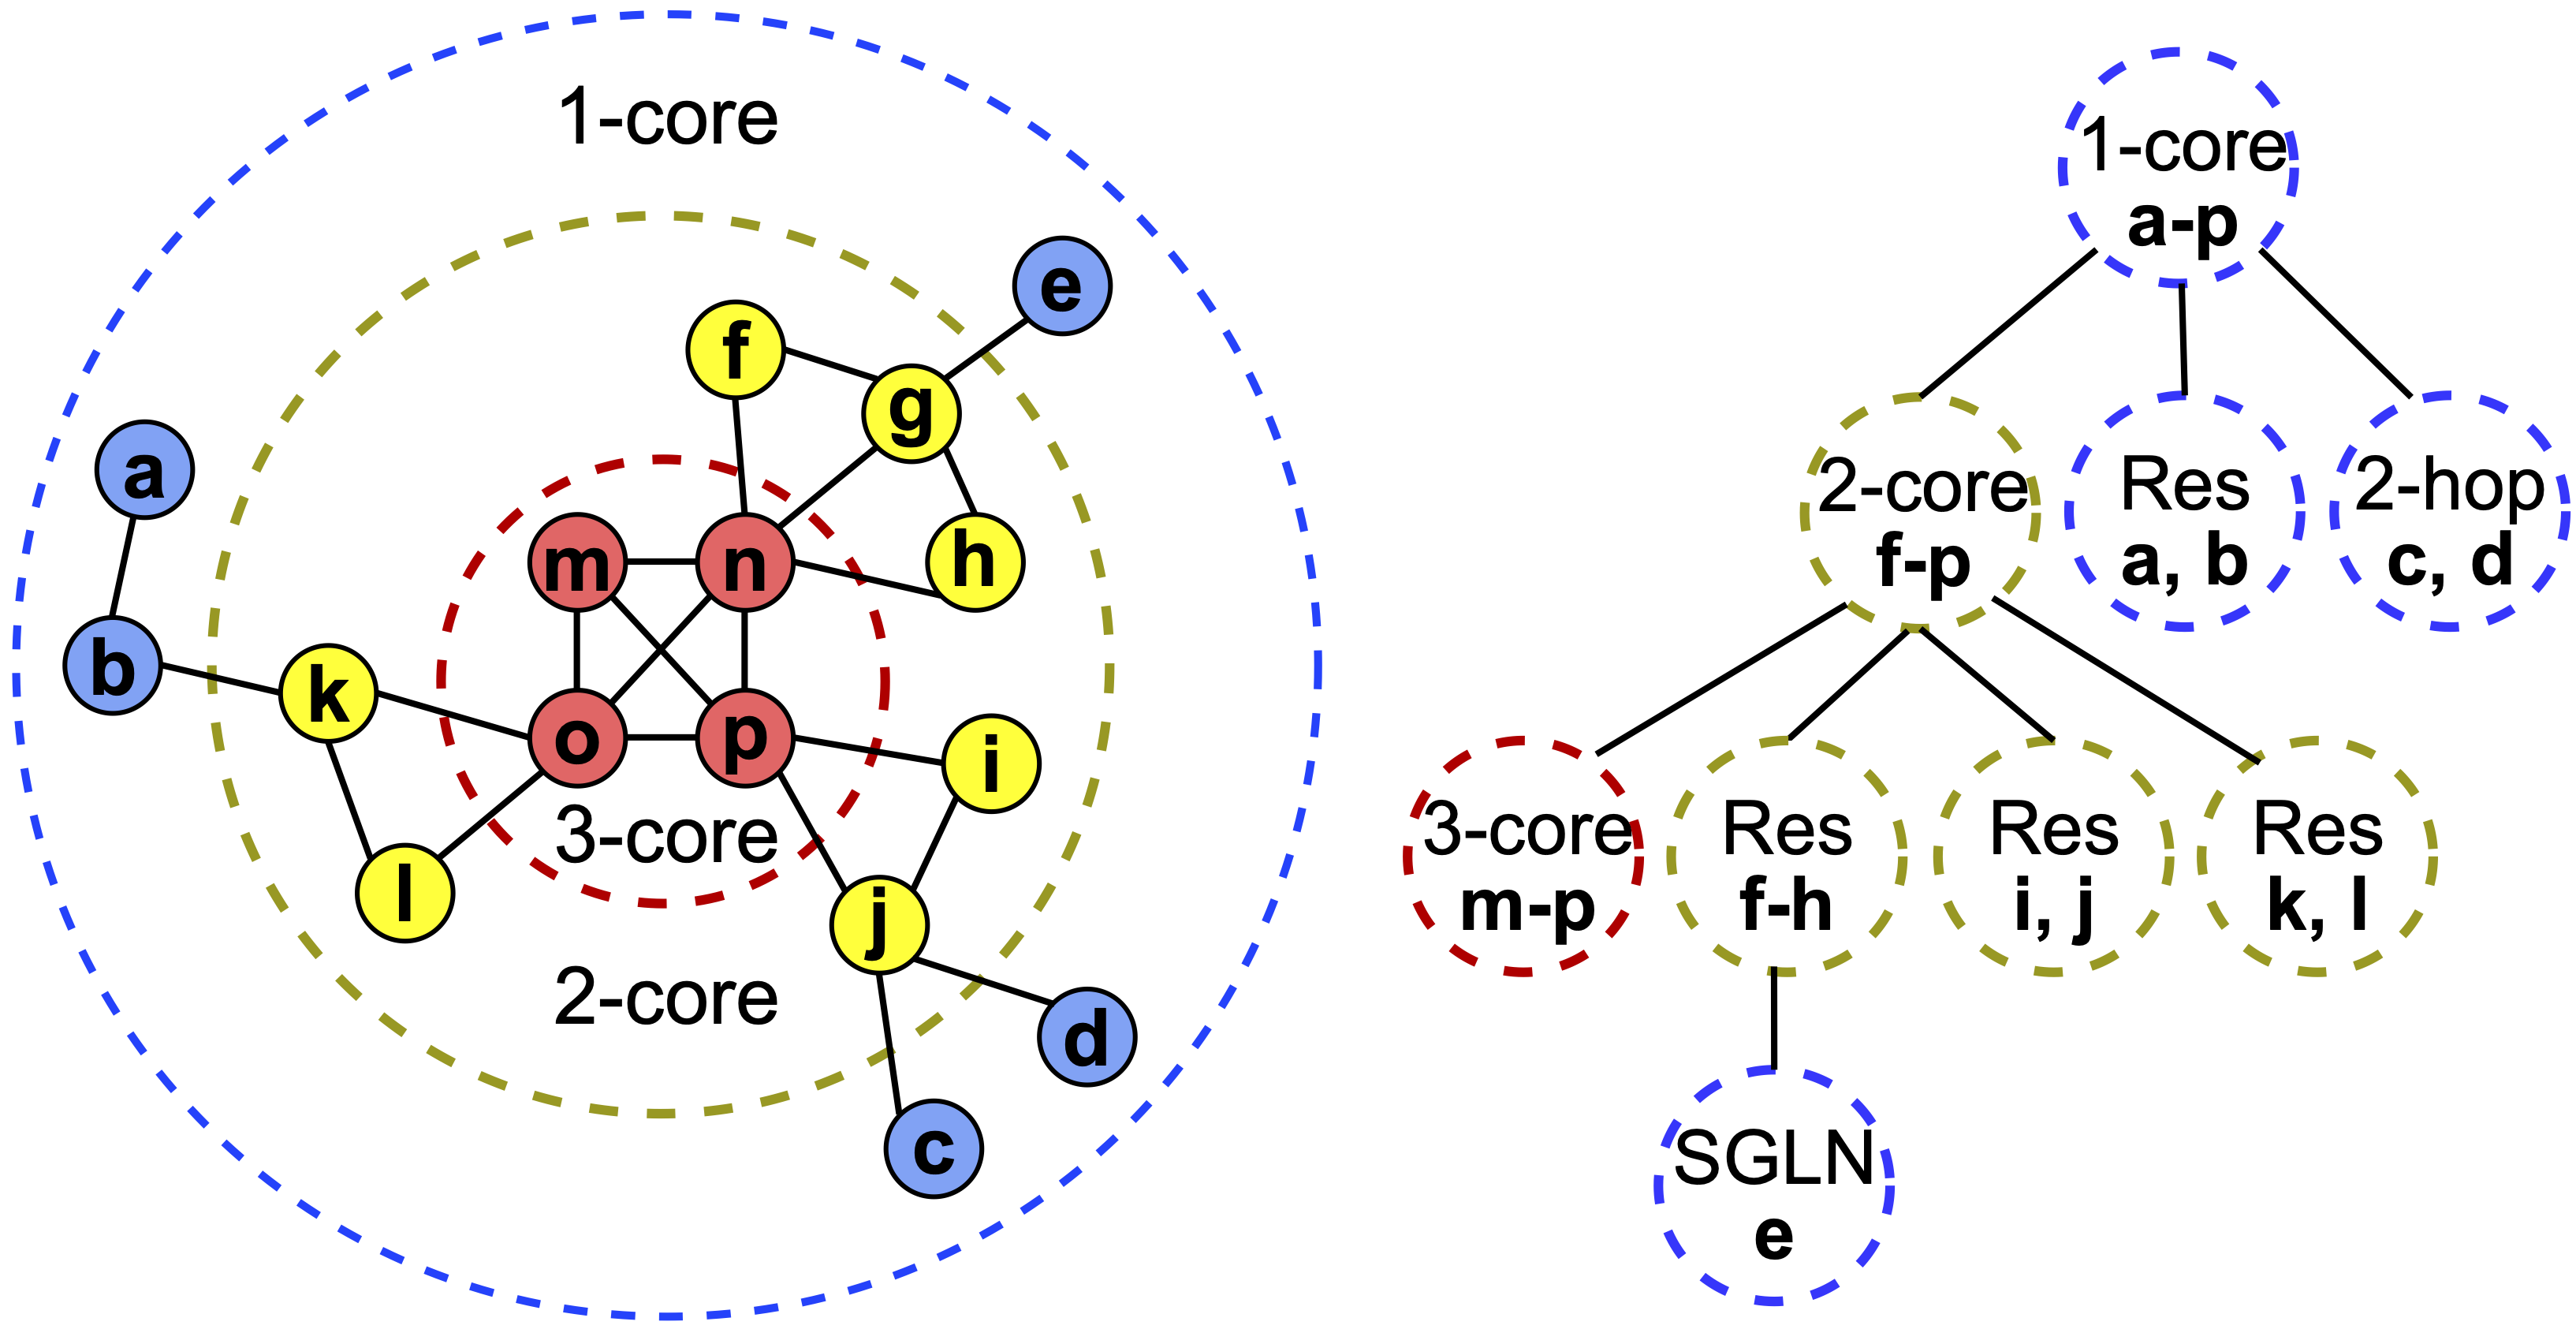
<?xml version="1.0" encoding="utf-8"?><feed xmlns="http://www.w3.org/2005/Atom" xml:lang="en"><generator uri="https://jekyllrb.com/" version="4.3.4">Jekyll</generator><link href="https://sariyuce.github.io/feed.xml" rel="self" type="application/atom+xml"/><link href="https://sariyuce.github.io/" rel="alternate" type="text/html" hreflang="en"/><updated>2026-08-30T18:39:49+00:00</updated><id>https://sariyuce.github.io/feed.xml</id><title type="html">blank</title><entry><title type="html">The math that could make UEFA’s draw fair for every team</title><link href="https://sariyuce.github.io/blog/2026/UEFA-Draw/" rel="alternate" type="text/html" title="The math that could make UEFA’s draw fair for every team"/><published>2026-08-25T00:00:00+00:00</published><updated>2026-08-25T00:00:00+00:00</updated><id>https://sariyuce.github.io/blog/2026/UEFA-Draw</id><content type="html" xml:base="https://sariyuce.github.io/blog/2026/UEFA-Draw/"><![CDATA[<p><em>A tight little cluster hidden in the 2025-26 Champions League draw shows why the “new format” needs one small tweak, and gives a beautiful excuse to talk about symmetric graphs.</em></p> <blockquote> <p><strong>TL;DR:</strong> UEFA’s new league-phase format can accidentally produce small clusters of teams that play each other disproportionately often, hurting their collective chance of advancing all at once. A single symmetric graph on 36 vertices, <a href="#winner-graph">C(36; ±{1, 4, 10, 17})</a>, eliminates this risk provably. Deploying it needs one small tweak to the country rule for UCL/UEL, and no tweak at all for UECL.</p> </blockquote> <hr/> <p><strong>Napoli, Benfica, Chelsea, Ajax, Qarabağ</strong>.</p> <p>In the 2025-26 UEFA Champions League, they are scheduled to play each other in <strong>nine of the ten possible pairings</strong>. Only Napoli-Ajax is missing from a complete round-robin among the five. The other nine (Napoli-Benfica, Benfica-Chelsea, Chelsea-Ajax, Ajax-Qarabağ, and five more) all happen in the league phase.</p> <div style="text-align:center; margin:1em 0;"> <img src="/assets/img/uefa-draw/cluster_ucl_2526.png" alt="UCL 2025-26 cluster: Napoli, Benfica, Chelsea, Ajax, Qarabağ, 9 of 10 pairings" style="max-width:520px; width:100%;"/> <div style="font-size:0.85em; color:#555; margin-top:4px;"><b>UCL 2025-26</b> - 9 of 10 possible games scheduled.</div> </div> <p>That’s an oddly tight little cluster in a 36-team competition. And it’s the kind of thing that isn’t supposed to happen anymore.</p> <p>Except it does, every season, in almost every UEFA continental competition. In UCL 2024-25 (the first year of the new format), Bayer Leverkusen, Atlético Madrid, Feyenoord, RB Salzburg and Sparta Prague play each other 9 of 10 times. In UEL 2024-25, Roma, Tottenham, AZ, Galatasaray, and IF Elfsborg do the same. UEL 2025-26 has a maximum 5-team cluster of 8 out of 10; UECL 2025-26 has 7 out of 10.</p> <table style="width:100%; border-collapse:collapse; margin:1em 0;"> <tr> <td style="width:50%; padding:6px; vertical-align:top; text-align:center;"> <img src="/assets/img/uefa-draw/cluster_ucl_2425.png" alt="UCL 2024-25: Leverkusen, Atlético, Feyenoord, Salzburg, Sparta, 9 of 10 pairings" style="width:100%; max-width:460px;"/> <div style="font-size:0.85em; color:#555; margin-top:4px;"><b>UCL 2024-25</b> — 9 of 10</div> </td> <td style="width:50%; padding:6px; vertical-align:top; text-align:center;"> <img src="/assets/img/uefa-draw/cluster_uel_2425.png" alt="UEL 2024-25: Roma, Tottenham, AZ, Galatasaray, Elfsborg, 9 of 10 pairings" style="width:100%; max-width:460px;"/> <div style="font-size:0.85em; color:#555; margin-top:4px;"><b>UEL 2024-25</b> — 9 of 10</div> </td> </tr> <tr> <td style="width:50%; padding:6px; vertical-align:top; text-align:center;"> <img src="/assets/img/uefa-draw/cluster_uel_2526.png" alt="UEL 2025-26: Feyenoord, Braga, Red Star, Celtic, Sturm Graz, 8 of 10 pairings" style="width:100%; max-width:460px;"/> <div style="font-size:0.85em; color:#555; margin-top:4px;"><b>UEL 2025-26</b> — 8 of 10</div> </td> <td style="width:50%; padding:6px; vertical-align:top; text-align:center;"> <img src="/assets/img/uefa-draw/cluster_uecl_2526.png" alt="UECL 2025-26: AZ, Slovan Bratislava, Rayo Vallecano, Jagiellonia Białystok, Shkëndija, 7 of 10 pairings" style="width:100%; max-width:460px;"/> <div style="font-size:0.85em; color:#555; margin-top:4px;"><b>UECL 2025-26</b> — 7 of 10</div> </td> </tr> </table> <details> <summary style="cursor:pointer; color:#555;"><i>Click to expand: full stats across all five competitions</i></summary> **How many dense clusters, per season?** <table> <thead> <tr> <th>Season</th> <th style="text-align:right">5-team clusters with ≥7 matches</th> <th style="text-align:right">≥8 matches</th> <th style="text-align:right">=9 matches</th> <th style="text-align:right; border-left:2px solid #666;">4-team clusters with ≥5 matches</th> <th style="text-align:right">=6 matches</th> </tr> </thead> <tbody> <tr> <td>UCL 2024-25</td> <td style="text-align:right">225</td><td style="text-align:right">17</td><td style="text-align:right">3</td> <td style="text-align:right; border-left:2px solid #666;">84</td><td style="text-align:right">4</td> </tr> <tr> <td><b>UCL 2025-26</b></td> <td style="text-align:right"><b>332</b></td><td style="text-align:right"><b>29</b></td><td style="text-align:right"><b>1</b></td> <td style="text-align:right; border-left:2px solid #666;"><b>109</b></td><td style="text-align:right"><b>5</b></td> </tr> <tr> <td>UEL 2024-25</td> <td style="text-align:right">240</td><td style="text-align:right">17</td><td style="text-align:right">2</td> <td style="text-align:right; border-left:2px solid #666;">87</td><td style="text-align:right">3</td> </tr> <tr> <td>UEL 2025-26</td> <td style="text-align:right">146</td><td style="text-align:right">6</td><td style="text-align:right">0</td> <td style="text-align:right; border-left:2px solid #666;">60</td><td style="text-align:right">0</td> </tr> <tr> <td>UECL 2025-26 (6 matches, not 8)</td> <td style="text-align:right">35</td><td style="text-align:right">0</td><td style="text-align:right">0</td> <td style="text-align:right; border-left:2px solid #666;">14</td><td style="text-align:right">0</td> </tr> </tbody> </table> Two things jump out: (i) every completed UCL/UEL season has produced a cluster with 8 or more internal matches, and (ii) 2025-26 UCL is actually the season with the most 8+ clusters we have on record (29 subsets), though only one hits 9. UECL is meaningfully less dense because it uses a sparser structure (6 opponents per team, not 8). </details> <h2 id="what-uefa-changed-in-2024">What UEFA changed in 2024</h2> <p>For decades, the Champions League and its sister competitions used the same shape: 32 teams, 8 groups of 4, a round-robin within each group. Each team played 6 group-stage matches (three opponents faced twice each) before the top two per group advanced.</p> <p>In 2024-25, UEFA scrapped that. In its place: a single 36-team “league phase” where each team plays 8 different opponents (2 from each of 4 seeded pots), and a single 36-team table sorts everyone into three buckets: top 8 auto-advance to the round of 16, teams ranked 9-24 go to a knockout playoff, teams 25-36 are eliminated. The same format runs across all three UEFA men’s competitions: Champions League (UCL), Europa League (UEL), Conference League (UECL).</p> <p>The sales pitch was reasonable. More marquee matches. More competitive standings. No more “dead rubber” final matchday when both advancing teams have qualified already. And the “single table” framing removes the arbitrary group draw, which had famously produced imbalanced “groups of death” for years.</p> <p>But it introduced a subtler risk that nobody flagged at the time.</p> <hr/> <h2 id="hidden-clusters">Hidden clusters</h2> <p>Here’s the thing about 36 teams each playing 8 opponents: it produces a huge network of 144 matches, and inside that network you can find small clusters of teams that happen to play each other disproportionately often. Not because anyone designed it that way; because the draw is random and 144 edges among 36 teams have to land somewhere.</p> <p>Think of the league phase as a graph: <strong>36 nodes</strong>, one per team; <strong>144 edges</strong>, one per scheduled match. Every team-node touches exactly 8 edges (its 8 opponents). A dense cluster is a small clump of nodes with an unusually large number of edges <em>inside</em> the clump.</p> <p>Here’s what the actual 2025-26 UCL looks like as one such graph:</p> <div style="text-align:center; margin:1em 0;"> <img src="/assets/img/uefa-draw/ucl_ring.png" alt="UCL 25-26 as a graph: 36 team-nodes (grouped by pot) around the ring, 144 match-edges as chords. Red edges highlight the 9 internal pairings of the Napoli-Benfica-Chelsea-Ajax-Qarabağ cluster" style="max-width:820px; width:100%;"/> <div style="font-size:0.85em; color:#555; margin-top:6px;">UCL 2025-26 as a graph. 36 team-nodes around the ring, grouped by pot; 144 match-edges drawn as chords. The 9 red edges are the internal pairings of the Napoli-Benfica-Chelsea-Ajax-Qarabağ cluster.</div> </div> <p><em>Want to poke at the graph yourself? Here’s an <a href="https://sariyuce.github.io/assets/uefa-draws/"><strong>interactive viewer for all five past draws (UCL, UEL, UECL, 2024–26)</strong></a> with re-layout, pot/country coloring, and cluster highlighting.</em></p> <p>The Napoli-Benfica-Chelsea-Ajax-Qarabağ cluster is the extreme case. Of the 376,992 different ways to pick 5 teams out of 36, the actual UCL 25-26 draw has <strong>332 different 5-team clusters with 7 or more internal matches, 29 with 8 or more, and exactly one (the Qarabağ cluster) with 9</strong>, the unique maximum.</p> <p><strong><em>Why does that matter?</em></strong></p> <p>Here’s the arithmetic. Each of the 5 cluster teams plays 8 matches, giving the cluster a total of 5 × 8 = <strong>40 team-match slots</strong> across the season. Nine of those matches are internal (both teams from the cluster), and each internal match uses up 2 slots (one per participant). So internal matches consume 2 × 9 = <strong>18 slots</strong>, leaving <strong>22 slots</strong> for matches against teams outside the cluster.</p> <p>Each match distributes at most 3 points (all to the winner) or 2 (a draw). If all 40 slots were external, the cluster could collect up to 40 × 3 = <strong>120 points</strong> worth of “point-mining” opportunities against outsiders. But an internal match doesn’t work that way: the 3 winner-points <em>have</em> to go to a cluster team, and the other cluster team gets 0 (or in a draw, both get 1). Points don’t leave the cluster.</p> <p>In short: <strong>each internal match trades what could be 6 collectible points against outsiders for 3, or 2, redistributed points within the cluster.</strong> The cluster’s collective point ceiling drops from 120 (with 0 internal matches) to 120 − 3 × 9 = <strong>93 points</strong> (with 9 internal matches).</p> <p>Divided among 5 teams, that’s an average of 18.6 points per team. In principle enough; top-24 cutoff hovers around 8-11 points. But that’s just the ceiling. Reality is worse.</p> <p><em>If you’d rather skip the math and simulations, jump directly to <a href="#what-this-changes">what changes under the fix ↓</a>.</em></p> <hr/> <h2 id="someone-in-the-cluster-always-pays">Someone in the cluster always pays</h2> <p>Beyond the point-ceiling arithmetic above, internal matches also <em>correlate</em> the cluster teams’ fortunes negatively. Every match has a winner and a loser (or two draws), so if Napoli does well internally then someone else in the cluster is doing badly. For “all 5 teams jointly reach the playoff cutoff” to happen, <em>no</em> team can be below the cutoff, and internal matches actively work against that.</p> <p>The cleanest way to see this in a number is a controlled experiment: take five equally-strong teams (just assume for a moment), drop them into the actual 2025-26 UCL field, and vary only the number of matches they play against each other from 0 up to the maximum of 10 (a 5-clique; every one of the 10 possible pairings among the five is scheduled). Their joint chance of <em>all</em> reaching top-24 responds like this (20,000 Monte Carlo sims per cell):</p> <div style="text-align:center; margin:1em 0;"> <img src="/assets/img/uefa-draw/joint_p_by_m.png" alt="Bar chart of joint P(all 5 reach top-24) as a function of internal-match count m, from m=0 (16.9%) to m=10 (10.4%). The actual Qarabağ cluster sits at m=9." style="max-width:720px; width:100%;"/> </div> <p>Read that as a per-internal-match tax on the cluster: each additional internal pairing costs the group roughly 0.6-0.7 percentage points of joint fate. Going from a fully external schedule to a fully internal one takes joint P from about 17% down to 10%. That’s the pure <em>structural</em> effect of density; team strengths are held equal.</p> <p><em>(m = 10 hasn’t happened in any real UCL/UEL draw yet; the max observed is 9. But nothing in UEFA’s rules forbids it, so it belongs in the range we’re testing.)</em></p> <p>Real clusters are worse, because their members aren’t equally strong. Napoli, Benfica, Chelsea, Ajax, and Qarabağ have very different strengths (e.g., clubelo.com ratings); Qarabağ in particular sits well below the other four, and “all 5 advance” is bottlenecked by the weakest member. Re-running the simulation with each team’s <em>actual</em> Elo, the joint probability that all five reach top-24 drops to about <strong>1.4%</strong>, versus <strong>4.2%</strong> for a strength-matched 5-team group drawn at a typical position in the actual draw (roughly 2 internal matches on average, versus the Qarabağ cluster’s 9). That’s a <strong>68% relative reduction</strong> in joint fate, purely from the structural density of their pairings.</p> <p>One important asymmetry: <strong>dense clusters can only form among teams that are actually allowed to play each other</strong>. UEFA’s country rule bans same-country matchups, so, say, two English teams <em>can never</em> land in the same cluster with each other. Countries with many teams are <em>automatically shielded</em> from ever being co-clustered internally. The risk of getting sucked into a Napoli-Benfica-Chelsea-Ajax-Qarabağ cluster therefore falls disproportionately on teams from small federations.</p> <p>The point isn’t that this specific draw was cursed; it’s somewhat above average in cluster density (roughly top 20% of comparable random draws we simulated), not statistically extreme. It’s that <strong>the format allows this</strong>. Any of the three competitions can produce a Napoli-Benfica-Chelsea-Ajax-Qarabağ like situation in any future season. <em>It’s a structural risk of running a random draw over a graph this dense</em>. So the question becomes: is there a way to eliminate that risk <em>by design</em>, rather than hoping the random draw stays kind?</p> <hr/> <h2 id="the-fairness-principle-nobody-sits-in-a-worse-seat-than-anyone-else">The fairness principle: nobody sits in a worse seat than anyone else</h2> <p>Here’s the fairness question, framed a bit abstractly. In the actual UCL 25-26 draw, Qarabağ ended up sitting in the middle of the densest 5-team cluster. Pafos didn’t. Neither team chose their opponents; that was decided by the random draw. But the <em>positions</em> they landed in were structurally different: Qarabağ’s opponent set overlaps a lot with other teams’ opponent sets (they share opponents), while Pafos’s overlaps less.</p> <p>To be clear, “Qarabağ sits in a dense cluster” is not the same as “Qarabağ will finish last”. Qarabağ (Pot 4) had a genuinely fine 2024-25 campaign under the new format; single teams beat their expected finish all the time. What the cluster analysis says is that the <em>five of them jointly</em> are less likely to <em>all</em> advance; some subset almost certainly will.</p> <p>In fact, look back at last year’s analogous 5-team cluster in UCL 24-25 (Leverkusen, Atlético, Feyenoord, Salzburg, Sparta): three of them made top-24 (Leverkusen, Atlético, Feyenoord); the other two (Salzburg and Sparta) didn’t. And of the current Pot-3 pair Ajax + Napoli, both missed top-24 last season in similar tight-cluster situations. The pattern is: dense cluster ⇒ some cluster team pays the price; which particular team is a matter of individual form. The unfairness is <em>at the cluster level</em>, distributed across the affected teams.</p> <p>You can’t blame the draw for “picking bad teams to play”; every team is equally likely to draw any opponent; but you can ask: what if the <em>graph of positions</em> were designed so that no position is worse than any other?</p> <p>In graph theory, this is called <strong>vertex-transitivity</strong>. A graph is vertex-transitive if you can slide any vertex onto any other vertex and the picture looks unchanged. Every vertex has the same number of neighbors (that’s just being “regular”), but also the same number of 2-hop neighbors, the same number of 3-cycles through it, the same number of 4-cycles, the same everything. If your team is at “position 7” instead of “position 12,” your structural situation is <em>identical</em>; only the specific identities of your opponents change.</p> <p>That’s a strong fairness property. Draws would still be random (which specific team lands at which vertex depends on the balls that come out), but no team could complain that their <em>position</em> was worse than another team’s. Only their opponents’ <em>strengths</em>; which is the kind of luck fans accept.</p> <hr/> <h2 id="the-math-cayley-graphs">The math: Cayley graphs</h2> <p>How do you construct a vertex-transitive graph on 36 vertices where every team has 8 opponents split across 4 pots the way UEFA wants?</p> <p>One classical answer: <strong>Cayley graphs</strong>. Take the integers modulo 36 as your vertex set; think of them arranged around a clock face with 36 tick marks. Pick a small set of “offsets”.</p> <p>For a first illustration, try the offset set {±1, ±4, ±6, ±11}. Connect each vertex <code class="language-plaintext highlighter-rouge">i</code> to the eight vertices at <code class="language-plaintext highlighter-rouge">i ± 1</code>, <code class="language-plaintext highlighter-rouge">i ± 4</code>, <code class="language-plaintext highlighter-rouge">i ± 6</code>, <code class="language-plaintext highlighter-rouge">i ± 11</code> (mod 36).</p> <p>Because the same offsets apply to every vertex, every vertex has the same local neighborhood <em>by construction</em>. Shift-invariant. Perfectly vertex-transitive.</p> <p>Now line that up with UEFA’s pot structure. Partition the 36 vertices by their residue mod 4: vertices 0, 4, 8, …, 32 are “pot A”; vertices 1, 5, 9, …, 33 are “pot B”; and so on. There are 9 vertices in each pot, matching UEFA’s 4 pots of 9.</p> <p>For each offset, we can figure out which pot it lands you in. Offset ±4 keeps you in the same pot (within-pot opponent). Offset ±6 puts you in an adjacent pot (residue 2 mod 4 gives a “shift by 2 pots”). Offset ±1 or ±11 puts you in an adjacent pot. Pick offsets carefully and every vertex ends up with <strong>2 opponents in each pot</strong>: exactly what UEFA requires.</p> <p>So a properly-chosen offset set gives us: 8 opponents per team, 2 from each pot, perfectly vertex-transitive, algorithmically simple. That’s the whole idea. But not every offset set is good; some create dense clusters even worse than the actual UCL draw. Now we just have to find the <em>best</em> set of offsets.</p> <hr/> <h2 id="which-offsets-are-best">Which offsets are best?</h2> <p>Vertex-transitivity guarantees fair <em>positions</em>, but not automatically a <em>sparse</em> graph, so we want to pick the offset set that minimizes local density. The first bar is <strong>triangle elimination</strong>: no three teams among the 36 all play each other (a triangle is the smallest possible dense cluster). Triangles can be eliminated entirely for a subset of offset choices. Four-cycle elimination would be lovely too, but it’s provably impossible on 36 vertices (Moore’s bound says an 8-regular graph with no 4-cycles needs at least 1 + 8 + 8·7 = 65 vertices); the best we can do is <em>minimize</em> how many 4-cycles each team sits inside.</p> <p>There are 432 valid choices of offset sets that satisfy the UEFA pot structure. Of those, only 21 distinct graphs remain after we throw out anything with triangles and collapse mathematically-equivalent candidates. We ranked those 21 on five fairness metrics, and all five point at the same winner: <strong>C(36; ±{1, 4, 10, 17})</strong>.</p> <details> <summary style="cursor:pointer; color:#555;"><i>Click to expand: the fairness metrics we tested and the winner's numbers</i></summary> The five metrics, in plain terms: 1. **Fewest short cycles per team**: how tangled is your local neighborhood, at cycle lengths 4, 5, 6, and up. 2. **Most uniform "shared opponents" distribution**: no team's opponents are unusually intertwined with any other team's. 3. **Fewest dense 5-team clusters**: count of 5-team subsets that reach the maximum internal-match count allowed by the graph structure. 4. Uniformly-weighted sum of cycle counts. 5. Small-cycle-heavier weighted sum of cycle counts. All five agree. What the winner buys you: - Only 42 four-cycles per team (compared to 49-132 for other candidates). - Standard deviation of shared-opponents is 0.94 (next lowest is 1.18; the pathological worst case has 2.75). - No five-team cluster in the graph exceeds 6 internal matches. Ever. And only 252 clusters even reach 6 (compared to 360-1080 for the other candidates). - The tightest possible "both sides play all of the other side" subgraphs are small: no such structure has 3+ teams on both sides. </details> <p><br/> Here’s the winner graph:</p> <div id="winner-graph" style="text-align:center; margin:1em 0;"> <img src="/assets/img/uefa-draw/fig5_symmetric.png" alt="The symmetric graph C(36; ±{1, 4, 10, 17}): vertices arranged on a circle, colored by pot" style="max-width:720px; width:100%;"/> <div style="font-size:0.85em; color:#555; margin-top:6px;">The symmetric graph <b>C(36; ±{1, 4, 10, 17})</b>. Vertex <i>i</i> is connected to <i>i</i> ± 1, <i>i</i> ± 4, <i>i</i> ± 10, <i>i</i> ± 17 (mod 36). Colors mark the four pots (residue mod 4).</div> </div> <p>Each vertex has 8 neighbors (<code class="language-plaintext highlighter-rouge">i ± 1</code>, <code class="language-plaintext highlighter-rouge">i ± 4</code>, <code class="language-plaintext highlighter-rouge">i ± 10</code>, <code class="language-plaintext highlighter-rouge">i ± 17</code>, all mod 36). The picture looks the same if you rotate it: that’s the vertex-transitivity.</p> <hr/> <h2 id="can-it-actually-be-deployed">Can it actually be deployed?</h2> <p>Almost. There’s one wrinkle: for the 2025-26 UCL team set (6 English teams, 5 Spanish, 4 Italian, 4 German, and 17 others from smaller federations), we tried to assign the 36 teams to the 36 vertices of C(36; ±{1, 4, 10, 17}) while respecting UEFA’s country rule (“no two teams from the same country play each other, and each team faces at most 2 opponents from any other country”).</p> <p>Using <a href="https://developers.google.com/optimization/cp/cp_solver">Google’s OR-Tools CP-SAT solver</a>, we proved: <strong>strictly impossible</strong>. There is no assignment. The country distribution is too concentrated in the top four federations for a vertex-transitive graph to accommodate.</p> <p>And this isn’t a 2025-26 quirk. The upcoming UCL 2026-27 draw on Thursday looks essentially the same: about 5 English, 5 Spanish, 4 Italian, 4 German, and possibly 4 French teams. The concentration in top federations is a permanent feature of modern qualification, not a one-off. So the strict rule is going to keep hitting the same wall every season on the symmetric graph.</p> <p>But two small policy tweaks each restore feasibility:</p> <ul> <li> <p><strong>Option A</strong>: raise the “max opponents from same country” cap from 2 to 3. A one-integer change to UEFA’s regulation. Same-country matchups are still forbidden; the change is only that a team may face up to 3, rather than 2, opponents from any single <em>foreign</em> country.</p> </li> <li> <p><strong>Option B</strong>: split each large federation (≥4 teams) into two sub-groups (e.g., ENG_A = {Chelsea, Man City, Tottenham}, ENG_B = {Liverpool, Arsenal, Newcastle}), then treat the sub-groups as if they were separate countries. Same-sub-group teams still don’t play, but cross-sub-group same-country matches (Liverpool vs. Chelsea) become allowed, capped at 2 per sub-group. A knock-on effect: a non-English team can now face up to 4 English opponents (2 from each sub-group).</p> </li> </ul> <p><strong>Option A</strong> preserves the intent of the country rule (limiting same-federation opponents to a small constant), whereas <strong>Option B</strong> can be considered fairer as the advantage of countries with many teams is reduced. Both make the perfectly symmetric graph deployable.</p> <p>A live draw ceremony under either option would look identical to, or even better than, today’s. The 36 team balls go into a drum. Each ball, when drawn, gets placed at one of the valid vertex positions using the same constraint-propagation software UEFA already uses. Between 100 million and 10 billion valid assignments exist: plenty of randomness for the draw to feel unpredictable. Computation is fast enough that it’s invisible to viewers: about 55 milliseconds of solver work per ball, roughly 2 seconds for the entire 36-ball draw. The ceremony’s pacing (the balls, the walk-outs, the presenters explaining what just happened) is set by theatrics, not by the compute, and would be unchanged.</p> <p><strong>And for UECL, they don’t even need the rule tweak.</strong> The Conference League’s 6-pot / 6-opponent structure has enough slack that a symmetric graph absorbs the country rule as-is. The winner in that setting is a Cayley graph on the group Z/18 × Z/2 with offset set {(1,0), (2,1), (9,0), (9,1), (16,1), (17,0)}; every team ends up with 1 opponent per pot, no same-country matchups, at most 2 opponents from any single foreign country. Zero regulation changes required.</p> <hr/> <h2 id="scheduling-after-the-draw">Scheduling after the draw</h2> <p>Assigning teams to positions is one half of deployment. The other half is scheduling the resulting matches into matchdays; and here too, the symmetric graph does something nice.</p> <p>Once the pairings are known, UEFA still has to slot the 144 matches into 8 matchdays so that no team plays twice on the same night (!). That’s the <em>scheduling</em> step. There’s a subtle catch here that <a href="https://papers.ssrn.com/sol3/papers.cfm?abstract_id=5413142">Guyon et al. (2025)</a> uncovered: some random draw outcomes (very rare, but mathematically possible) produce a match graph that <em>cannot</em> fit into 8 matchdays and would need 9. After they alerted UEFA of this, UEFA folded the 8-matchday-schedulability check into the draw software itself, so such outcomes are prevented upfront rather than fixed after the fact.</p> <p>Our fixed-graph approach removes the risk entirely. We verified with a constraint solver that:</p> <ul> <li>The UCL winner graph splits cleanly into <strong>8 matchdays</strong> of 18 matches each (7 is provably too few).</li> <li>The UECL winner graph splits cleanly into <strong>6 matchdays</strong> of 18 matches each (5 is provably too few).</li> <li>Under the natural home/away rule (“host if you’re the lower number modulo 36”), every team gets exactly <strong>4 home + 4 away</strong> in UCL (3+3 in UECL), and every matchday is a perfectly balanced 18-home / 18-away split. No optimizer needed; it falls out of the algebra.</li> </ul> <p>Everything else UEFA cares about (avoiding consecutive home games, spacing sensitive fixtures, TV-window rules) is about the <em>ordering</em> of the matchdays, not the graph itself, so their existing scheduler transfers unchanged.</p> <hr/> <p><a id="what-this-changes"></a></p> <h2 id="what-this-changes">What this changes</h2> <p>Under the current UEFA format, in any given season, some small group of teams may find themselves in a cluster like the Napoli-Benfica-Chelsea-Ajax-Qarabağ cluster; through no fault of their own. Their joint chances of advancement take a real hit from a structural accident of the draw. And crucially, this hits <em>unevenly at the federation level</em>. Individually, any team can still be pulled into a dense cluster: Liverpool could plausibly land in one with four non-English teammates, just as Qarabağ did. But no cluster can contain <strong>two or more teams from the same country</strong> (the same-country ban rules that out), so the Premier League as a whole cannot suffer the compounded hit that comes from having multiple of its own teams jointly stuck. Its six clubs are, in effect, distributed across up to six separate potential clusters instead of concentrated in one. Azerbaijan’s single UCL entrant has no such protection; whatever cluster it lands in, the whole national representation is exposed. The current system quietly rewards <strong>federations</strong> with many entrants, even when it does not shield any individual team.</p> <p>Under the <a href="#winner-graph">symmetric-graph proposal</a>, that can’t happen. Small dense clusters like the Napoli-Benfica-Chelsea-Ajax-Qarabağ pocket are structurally impossible in the new proposal. No team occupies a structurally worse position than any other team. The only source of asymmetry is opponent strength; which is a kind of luck fans understand and accept.</p> <p>Fairness stops being a statistical property of the random draw and becomes a <strong>mathematical property of the graph itself</strong>: provable per-team, for every team, every season. The math is done and public. All that’s left is a decision: change one line of the country rule, publish one fixed graph, and clusters like Napoli-Benfica-Chelsea-Ajax-Qarabağ stop being possible.</p> <hr/> <h2 id="update--the-2026-27-draws-are-in-with-two-clean-forward-predictions">UPDATE — the 2026-27 draws are in, with two clean forward predictions</h2> <p>The 2026-27 league-phase draws for UCL, UEL, and UECL are completed a few days ago, and the hidden-cluster pattern shows up in all three. The most interesting cases this year aren’t the single-densest tuples — they’re <strong>two balanced high-strength six-team clusters in the UCL</strong> that make for unusually clean forward tests of the argument.</p> <p>The first is <strong>PSG, Manchester City, Barcelona, Sporting CP, Aston Villa, Galatasaray</strong> — 11 of 15 possible pairings scheduled among themselves. Split it by pot: the top three (PSG/City/Barcelona) are near-certain to advance individually, but the bottom three (Sporting/Villa/Galatasaray) play each other twice inside the cluster (Sporting-Gala and Villa-Gala are both scheduled) and each also plays two of the top-three elites. Galatasaray is the doubly-squeezed one, with only four external games. Under the density-penalty mechanism, at least one, likely two, of {Sporting, Villa, Galatasaray} will miss top-24, and Galatasaray is the highest-risk.</p> <p>The second is <strong>Bayern, Arsenal, Dortmund, Real Betis, Lille, Bodø/Glimt</strong> — same 11-of-15 density, same anatomy. Real Betis draws all three elites (Bayern + Arsenal + Dortmund) plus Lille, leaving only four external games. Lille is the doubly-squeezed peer here (playing both Betis and Bodø). At least one of {Betis, Lille, Bodø/Glimt} is at real risk of missing top-24, with Betis and Lille the leading candidates. UEL 2026-27 and UECL 2026-27 also produced max-density 6-tuples this year, but both have one clearly-weakest team (Lillestrøm in the UEL cluster; Kairat in the UECL one), which makes those cases confounded rather than clean tests of the mechanism.</p> <p>Two seasons in a row now, across all three UEFA continental competitions, the same structural risk keeps producing the same kind of little pit somewhere on the fixture list. It’s not an odd year. It’s the format. All three new draws are loaded into the <a href="https://sariyuce.github.io/assets/uefa-draws/">interactive tool</a>.</p> <hr/>]]></content><author><name></name></author><summary type="html"><![CDATA[A tight little cluster hidden in the 2025-26 Champions League draw shows why the "new format" needs one small tweak, and gives a beautiful excuse to talk about symmetric graphs.]]></summary></entry><entry><title type="html">Putting the Convergence Guarantee Back Into Parallel Louvain</title><link href="https://sariyuce.github.io/blog/2026/ParallelLouvain/" rel="alternate" type="text/html" title="Putting the Convergence Guarantee Back Into Parallel Louvain"/><published>2026-05-20T00:00:00+00:00</published><updated>2026-05-20T00:00:00+00:00</updated><id>https://sariyuce.github.io/blog/2026/ParallelLouvain</id><content type="html" xml:base="https://sariyuce.github.io/blog/2026/ParallelLouvain/"><![CDATA[<p>If you’ve ever clustered a graph in production, you’ve probably used Louvain. Introduced by Blondel and colleagues in 2008, the Louvain algorithm has become the default tool for finding communities in networks (just noticed that <a href="https://www.vincentblondel.be/">Vincent Blondel</a> became a rector at UCLouvain after this paper, then a senator, and now serves as the current president of the Belgian Senate - wow). Biologists use Louvain to group proteins. Bibliometric platforms use it to organize the scientific literature. Banks use it to find fraud rings. And more recently, it sits inside <a href="https://microsoft.github.io/graphrag/">GraphRAG</a> and similar systems, partitioning knowledge graphs so an LLM can write topic-level summaries instead of stitching together raw passages.</p> <p>What’s less well known is that the parallel implementations almost everyone uses today, the ones that actually make Louvain practical on graphs with hundreds of millions of edges, have quietly been violating Louvain’s own convergence proof for over a decade.</p> <p>Louvain itself is a simple, elegant idea. It is an agglomerative (bottom-up) clustering technique where each node starts as its own community. Louvain repeatedly cycles through two phases. In the local-move phase, it walks over every node in the graph and asks: is there a neighboring community I’d be happier joining? If the answer is yes — measured by a quantity called modularity, which compares the density of edges inside communities to what you’d expect by chance — the node moves. After a full sweep of moves, the algorithm collapses each community into a single super-node, builds a coarser graph from the result, and recurses. The original 2008 paper proves something important about this loop: modularity is non-decreasing across moves. Since modularity is bounded above and only finitely many partitions exist, the algorithm has to terminate. That termination guarantee is exactly what stops working the moment you parallelize (even in shared memory).</p> <p>The reason is subtle but well-understood. When multiple threads each ask “what’s the best move for my node?” at the same time, they’re all reading the current state of the communities. If two threads simultaneously decide to join the same community, each of them sees a positive modularity gain individually — but the joint effect, once both moves land, can actually be negative. Worse, two adjacent nodes can simultaneously decide to migrate into each other’s community, get no net gain, and end up in an infinite ping-pong, swapping back and forth on every iteration. Both failure modes come from the same root cause: each thread acts on stale information about what the other threads are doing.</p> <p>This isn’t a bug, exactly. It’s a structural consequence of running an inherently sequential computation in parallel. And every popular shared-memory implementation of parallel Louvain — Grappolo, PLMR, the Pull/Push variant — has worked around it the same way: heuristically. They cap the iteration count. They stop early when modularity improvements fall below a threshold. They shrug and accept that the algorithm “usually terminates in practice.”</p> <p>And this indeed works. But “usually terminates” isn’t the same thing as “guaranteed to terminate.” And as Louvain has crept into regulated industries, audit-sensitive pipelines, and AI infrastructure where correctness, traceability, and stability are essential, that distinction has started to matter. Louvain does not specify in which order the nodes must be processed, and hence there are many valid sequential runs with slightly different results. But parallelism without convergence makes it worse. Guaranteeing that a parallel Louvain run corresponds to some sequential execution brings meaningful operational value.</p> <p>Our paper, which we’ll present at <a href="https://www.ipdps.org/">IPDPS 2026</a>, gives the first parallel Louvain algorithms that come with a real convergence proof — not “converges in practice,” but provably terminates and produces a partition that’s mathematically equivalent to some sequential Louvain run. There are two of them.</p> <p>The first, <strong>distance-2 community coloring</strong>, is mostly there to make the theory crisp. The idea is to assign colors to nodes such that two nodes only share a color if they couldn’t possibly interfere — neither they nor their neighbors are members of overlapping communities. See the figure below. Nodes with the same color can then be processed in parallel, because the constraint guarantees their moves touch disjoint pieces of state. The catch is that the coloring depends on the current partition, so it has to be recomputed as communities merge. We do this incrementally. The proof is clean: any execution order on a color class yields the same partition as a sequential run, so the whole computation can be serialized back to standard Louvain. But it’s expensive in practice. Real-world graphs need wide color palettes, and you end up with many small color classes — lots of synchronization barriers, low utilization. This method demonstrates the principle but isn’t the one we’d actually recommend running.</p> <figure> <picture> <img src="/assets/img/d2cc-example.png" width="100%" height="auto" onerror="this.onerror=null; $('.responsive-img-srcset').remove();"/> </picture> <figcaption class="caption">Distance-2 community coloring on a toy graph. Dashed regions are communities. Same-colored nodes have no shared community in their neighborhoods, so they can be processed in parallel without conflict.</figcaption> </figure> <p>The second method, <strong>community versioning</strong>, is what we recommend. It borrows a well-known idea from database concurrency control: two-phase locking with version numbers. Each community gets a counter. An even number means the community is stable — safe to read. An odd number means someone is in the middle of modifying it.</p> <p>When a thread wants to move a node, it does three things. First, it reads the current state, only inspecting communities whose versions are even. Second, it computes the best possible move from that consistent snapshot. Third, it attempts to lock both the source and destination communities atomically, by checking that their versions haven’t changed since it first read them. If they haven’t, the move commits. If they have, which means some other thread modified one of those communities in the meantime, the thread reverts, defers the node to the next iteration, and tries again later.</p> <p>This sounds fiddly, but it’s exactly the kind of optimistic concurrency control that databases have used for decades to make concurrent transactions safe. The key property is that whenever a thread successfully commits a move, the modularity gain it computed is guaranteed to be valid — no other thread has touched the relevant communities between the read and the commit. From there, you can show that the entire parallel execution is serializable: there exists a sequential ordering of the committed moves that would produce the exact same final partition. And that sequential ordering is itself a valid Louvain run, which inherits the original convergence proof from the 2008 paper.</p> <p>So how does this perform? We tested on seven real-world graphs ranging up to Orkut at 117 million edges, on a 40-core machine. The headline: our versioning-based method, which we call VLM, matches the speed of PLMR and Grappolo closely across the board — sometimes faster, sometimes slower, but never far off. On each dataset, VLM either produces the highest modularity or sits within a narrow range of the best heuristic baseline. Against sequential Louvain, the only other method that also guarantees convergence, VLM is around 435 times faster on the largest network we tested. And on a synthetic graph with 40 million nodes and 400 million edges, it finishes in under five minutes.</p> <p>Most importantly, every run produces an outcome that can, in principle, be traced back to a deterministic sequential execution. No heuristic patches. No early-termination thresholds papering over a missing proof. Just an algorithm that does what it claims to do.</p> <p>If you’re running Louvain — or its close cousin Leiden, which uses the same local-move phase and is even more popular today — at any kind of scale where reproducibility matters, this is the trade-off we think is worth making. You give up at most a small constant factor in wall-clock time. In exchange, you get something the existing parallel methods cannot offer: a guarantee that the algorithm finishes, and that what it finishes with is consistent with the theory it’s supposed to be implementing.</p> <p>On a personal note, this work felt like nostalgia. Graph coloring is the closest I’ve come to practicing an art. My very first paper was on parallel graph coloring, with my then-PhD advisor Ümit. Fifteen years later, here’s another parallel graph algorithm — coloring again — but this time with my own PhD advisee Jason, his academic grandfather Ümit, and his academic uncle Yusuf. Onward to the next coloring.</p>]]></content><author><name></name></author><summary type="html"><![CDATA[If you’ve ever clustered a graph in production, you’ve probably used Louvain. Introduced by Blondel and colleagues in 2008, the Louvain algorithm has become the default tool for finding communities in networks (just noticed that Vincent Blondel became a rector at UCLouvain after this paper, then a senator, and now serves as the current president of the Belgian Senate - wow). Biologists use Louvain to group proteins. Bibliometric platforms use it to organize the scientific literature. Banks use it to find fraud rings. And more recently, it sits inside GraphRAG and similar systems, partitioning knowledge graphs so an LLM can write topic-level summaries instead of stitching together raw passages.]]></summary></entry><entry><title type="html">Why GraphRAG Needs a Better Backbone Than Leiden Clustering</title><link href="https://sariyuce.github.io/blog/2026/GraphRAG/" rel="alternate" type="text/html" title="Why GraphRAG Needs a Better Backbone Than Leiden Clustering"/><published>2026-03-10T00:00:00+00:00</published><updated>2026-03-10T00:00:00+00:00</updated><id>https://sariyuce.github.io/blog/2026/GraphRAG</id><content type="html" xml:base="https://sariyuce.github.io/blog/2026/GraphRAG/"><![CDATA[<p>If you’ve built a RAG pipeline, you’ve probably hit the ceiling: your system handles factual lookups well, but falls apart when someone asks a question that requires synthesizing an entire corpus. “What strategies have semiconductor companies adopted in response to supply chain disruptions over the past decade?” No single retrieved chunk will answer that. You need the system to reason across hundreds of documents, identify recurring themes, and reconcile conflicting perspectives. This is what people call global sensemaking, and it’s where standard RAG reaches its limits.</p> <p><a href="https://microsoft.github.io/graphrag/">GraphRAG</a>, introduced by Edge et al. at Microsoft Research, was a significant step forward for corpus-level question answering. Their key insight was to add a structural layer on top of the corpus. First, an LLM extracts entities and relationships from text chunks, building a knowledge graph. Then, the graph is partitioned into hierarchical communities using Leiden clustering, a popular modularity-based community detection algorithm. Each community gets recursively summarized, and at query time, these summaries are retrieved and aggregated through a map-reduce process to produce a final answer. It’s a clever architecture: instead of retrieving raw passages, you’re retrieving pre-computed summaries of coherent topic clusters.</p> <p>But there’s a structural problem hiding in the community detection step. Knowledge graphs have very little local connectivity to work with. Average node degrees tend to be in the low single digits, and a majority of nodes often have just a single connection. Leiden works by optimizing modularity, a score that compares edge density within communities to what you’d expect by chance. When most nodes barely participate in the graph, that comparison loses much of its discriminative power. We prove that in this regime, the number of near-optimal partitions grows exponentially with graph size. In plain terms: Leiden is choosing one partition from an astronomically large set of equally good options, guided more by its random seed than by genuine structure. Run it twice, get different communities, get different summaries, get different answers. That’s a reproducibility problem you don’t want in a production pipeline.</p> <p>Our alternative is k-core decomposition, a classical graph algorithm that organizes a network into nested layers of increasing minimum degree. The idea is simple: repeatedly peel away nodes with the fewest connections. What remains at each step is a progressively denser and more tightly connected subgraph. Every node gets assigned a core number, the largest k for which it belongs to a subgraph where every node has at least k neighbors. This creates a natural hierarchy: the outer layers capture peripheral entities, while the inner cores correspond to the most interconnected, topically central parts of the knowledge graph. The figure below illustrates this on a small example: the left side shows the core layers, and the right side shows the resulting hierarchy tree.</p> <figure> <picture> <img src="/assets/img/kcore-example.png" width="100%" height="auto" onerror="this.onerror=null; $('.responsive-img-srcset').remove();"/> </picture> <figcaption class="caption">K-core decomposition layers (left) and the resulting hierarchy tree (right).</figcaption> </figure> <p>Crucially, k-core decomposition is deterministic. There’s no optimization landscape, no random initialization, no sensitivity to seeds. The same graph always produces the same hierarchy. It also runs in linear time, making it strictly cheaper than Leiden. We build on this hierarchy with a set of lightweight heuristics that construct size-bounded communities suitable for LLM summarization, and handle small or residual clusters that naturally arise from the peeling process. On top of that, we introduce a separate token-budget-aware sampling strategy. In densely connected leaf-level communities, many nodes and edges carry overlapping information, and passing all of it to the LLM is both costly and redundant. Our sampler selects a representative subset of edges from each community in a round-robin fashion, keeping the most informative content while significantly cutting token usage.</p> <p>We evaluated our k-core heuristics against Leiden-based GraphRAG across three real-world datasets: podcast transcripts, news articles, and semiconductor earnings calls. For answer generation, we used three LLMs (GPT-3.5-turbo, GPT-4o-mini, and GPT-5-mini), and for evaluation we used five independent LLM judges in a head-to-head format, where each judge picks a winner, loser, or tie on every question. This setup was deliberately broad: we wanted to know whether the gains hold across different corpora, models, and evaluators, not just in one favorable configuration.</p> <p>They do. Across datasets and models, our k-core heuristics consistently improve both answer comprehensiveness (how thoroughly the answer covers all relevant aspects of a question) and diversity (how well it captures varied perspectives and insights). On GPT-3.5-turbo, our best-performing heuristic wins 55 to 65% of head-to-head comparisons depending on the dataset and metric, with statistical significance (p &lt; 0.005) across all three datasets for comprehensiveness. With stronger models like GPT-4o-mini and GPT-5-mini, the margins narrow as you’d expect, since the models’ own knowledge starts compensating, but the directional advantage on both metrics remains consistent.</p> <p>The efficiency story is equally compelling. Our heuristics naturally produce more compact community structures, using fewer communities and covering fewer total tokens than Leiden at comparable hierarchy levels. On top of that, our round-robin token sampling strategy can reduce token usage by up to 40% relative to Leiden while still maintaining competitive win rates in the 50 to 56% range. For anyone running GraphRAG at scale, that’s a meaningful cost reduction.</p> <p>There’s also a practical benefit that doesn’t show up in win rates: reproducibility. Because k-core decomposition is deterministic, the same corpus always produces the same communities, the same summaries, and the same retrieval behavior. There’s no variance from random seeds, no need to run the pipeline multiple times to check stability. For production systems, that predictability matters.</p> <p>If you’re building or maintaining a GraphRAG pipeline, the community detection step deserves more scrutiny than it usually gets. Leiden is a reasonable default for dense networks, but knowledge graphs aren’t dense networks, and the instability that follows has real downstream consequences. k-core decomposition, combined with a set of lightweight heuristics for community construction, sizing, and token budgeting, gives you a deterministic, efficient, and well-understood alternative that produces better summaries with fewer tokens. The code is publicly <a href="https://github.com/jakir-sust/Kcore-GraphRAG">available</a> and the full paper is on <a href="https://arxiv.org/abs/2603.05207">arXiv</a>.</p>]]></content><author><name></name></author><summary type="html"><![CDATA[If you’ve built a RAG pipeline, you’ve probably hit the ceiling: your system handles factual lookups well, but falls apart when someone asks a question that requires synthesizing an entire corpus. “What strategies have semiconductor companies adopted in response to supply chain disruptions over the past decade?” No single retrieved chunk will answer that. You need the system to reason across hundreds of documents, identify recurring themes, and reconcile conflicting perspectives. This is what people call global sensemaking, and it’s where standard RAG reaches its limits.]]></summary></entry></feed>